|
|
|
|
WOMEN AND MEN IN AZERBAIJAN
Statistical yearbook
Baku, State Statistical Committee of the Republic of Azerbaijan,
2025, 262 pages
|
https://www.stat.gov.az/menu/6/statistical_yearbooks/source/WM_2025.pdf
|
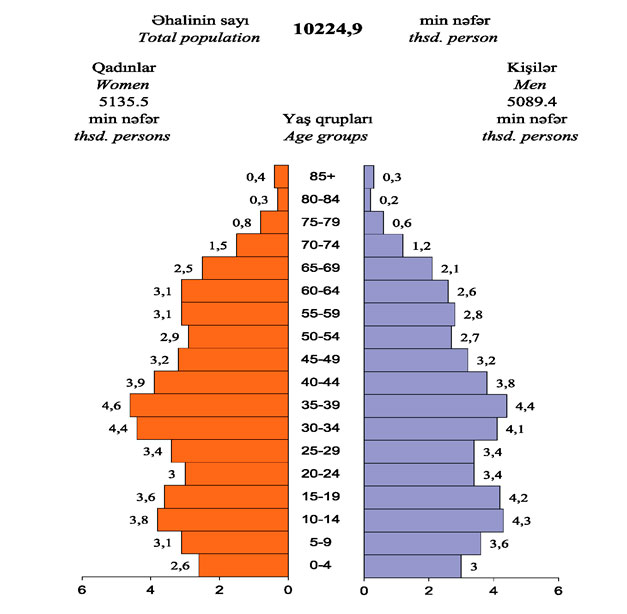
Структура населения по полу и возрасту
на 1 января 2025 г.
Число и процент от общего числа женщин и мужчин (стр. 21)
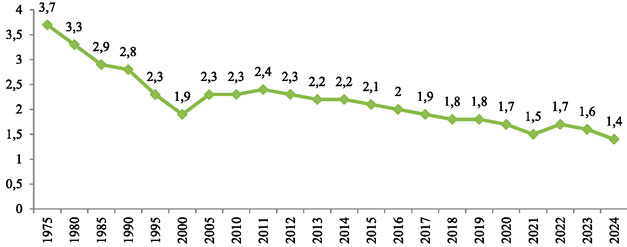
Суммарный коэффициент рождаемости (стр.
24)
Ожидаемая продолжительность жизни в возрасте
60 лет в городских и сельских местностях,
число лет (стр. 53)
|
Годы
|
Всего
|
Городские местности
|
Сельские местности
|
|
женщины
|
мужчины
|
женщины
|
мужчины
|
женщины
|
мужчины
|
|
2000
|
19,2
|
16,7
|
18,7
|
16,2
|
19,6
|
17,0
|
|
2001
|
19,6
|
17,2
|
19,0
|
16,6
|
20,2
|
17,8
|
|
2002
|
19,4
|
16,8
|
19,0
|
16,6
|
19,9
|
17,1
|
|
2003
|
18,9
|
16,5
|
18,7
|
16,4
|
18,8
|
16,5
|
|
2004
|
19,0
|
16,7
|
18,8
|
16,6
|
18,9
|
16,8
|
|
2005
|
19,5
|
16,8
|
19,0
|
16,6
|
19,3
|
16,8
|
|
2006
|
19,2
|
16,4
|
19,0
|
16,9
|
19,3
|
15,8
|
|
2007
|
19,2
|
16,6
|
19,2
|
17,0
|
19,4
|
16,5
|
|
2008
|
20,1
|
17,4
|
20,0
|
17,0
|
19,9
|
16,7
|
|
2009
|
20,0
|
17,1
|
20,2
|
17,8
|
20,0
|
16,3
|
|
2010
|
20,1
|
17,1
|
20,4
|
17,9
|
19,9
|
16,1
|
|
2011
|
20,3
|
17,4
|
20,7
|
18,2
|
19,8
|
16,2
|
|
2012
|
20,3
|
17,0
|
20,6
|
17,8
|
20,0
|
16,1
|
|
2013
|
20,2
|
17,4
|
20,5
|
18,1
|
19,9
|
16,8
|
|
2014
|
20,0
|
17,2
|
20,3
|
17,9
|
19,7
|
16,6
|
|
2015
|
21,3
|
19,3
|
21,7
|
20,2
|
20,7
|
18,3
|
|
2016
|
21,3
|
19,1
|
20,6
|
19,8
|
21,8
|
18,1
|
|
2017
|
21,5
|
19,4
|
21,1
|
20,1
|
20,7
|
18,4
|
|
2018
|
21,3
|
19,2
|
21,7
|
19,7
|
20,9
|
18,5
|
|
2019
|
21,6
|
19,5
|
21,9
|
20,1
|
21,2
|
18,7
|
|
2020
|
19,6
|
16,9
|
19,8
|
17,4
|
19,5
|
16,3
|
|
2021
|
19,5
|
17,1
|
19,1
|
16,9
|
20,1
|
17,5
|
|
2022
|
21,6
|
19,2
|
21,8
|
19,7
|
21,4
|
18,7
|
|
2023
|
22,3
|
20,1
|
22,6
|
20,8
|
21,9
|
19,3
|
|
2024
|
22,7
|
20,4
|
23,0
|
21,0
|
22,3
|
19,7
|
Перинатальный, неонатальный и пост-неонатальный
коэффициенты смертности (стр. 87)
|
Годы
|
Коэффициент перинатальной смертности на 1000 живорожденных
и мертворожденных
|
Коэффициент неонатальной смертности на 1000 живорожденных
|
Коэффициент постнеонатальной смертности на 1000
живорожденных
|
|
девочки
|
мальчики
|
девочки
|
мальчики
|
девочки
|
мальчики
|
|
2005
|
8,3
|
11,5
|
4,4
|
6,5
|
7,2
|
7,1
|
|
2006
|
9,7
|
10,7
|
5,4
|
5,8
|
5,7
|
6,8
|
|
2007
|
7,7
|
10,1
|
4,4
|
5,5
|
7,1
|
7,1
|
|
2008
|
8,6
|
10,7
|
5,0
|
5,8
|
6,2
|
5,8
|
|
2009
|
8,4
|
11,4
|
4,7
|
6,9
|
6,5
|
4,6
|
|
2010
|
8,7
|
11,1
|
5,7
|
7,4
|
5,3
|
4,1
|
|
2011
|
8,7
|
10,4
|
6,0
|
7,0
|
4,6
|
4,2
|
|
2012
|
8,2
|
10,9
|
6,0
|
7,6
|
4,5
|
3,5
|
|
2013
|
8,9
|
10,7
|
6,5
|
7,4
|
4,0
|
3,7
|
|
2014
|
7,9
|
9,9
|
5,3
|
6,7
|
4,2
|
4,2
|
|
2015
|
7,9
|
10,1
|
4,6
|
7,0
|
4,9
|
5,2
|
|
2016
|
7,0
|
9,0
|
4,6
|
6,2
|
5,1
|
6,6
|
|
2017
|
8,8
|
10,1
|
6,1
|
7,1
|
3,6
|
5,2
|
|
2018
|
9,3
|
10,6
|
6,0
|
6,8
|
4,1
|
5,2
|
|
2019
|
7,6
|
11,0
|
5,2
|
8,3
|
3,9
|
4,4
|
|
2020
|
7,1
|
8,5
|
4,3
|
5,3
|
4,3
|
5,6
|
|
2021
|
7,6
|
8,8
|
3,9
|
4,9
|
3,1
|
3,0
|
|
2022
|
7,5
|
8,7
|
4,1
|
4,7
|
3,5
|
3,3
|
|
2023
|
15,4
|
16,9
|
12,7
|
15,0
|
4,2
|
4,2
|
|
2024
|
11,9
|
13,7
|
8,4
|
10,7
|
4,4
|
4,1
|
|
В регулярно издаваемом сборнике представлены данные
о численности женщин и мужчин, их возрастной структуре, ожидаемой
продолжительности жизни, рождаемости, их состоянии здоровья, уровне
образования, занятости и заработной плате женщин и мужчин по видам
экономической деятельности, преступности, государственного управления
и т.д. как в целом по Азербайджану, так и по отдельным регионам.
CONTENTS
Foreword
Gender statistics
Graphics
1. Population
Methodological explanations
1.1. Population size and vital statistics
1.2. Number of women and men
1.3. Population by sex and age groups, as of 1 January 2025
1.4. Sex distribution of population by economic regions and administrative
territorial units of the Republic of Azerbaijan, as of 1 January
2025
1.5. Median age of population
1.6. Age dependancy ratio
1.7. Share of women among all persons aged 15 and above
1.8. Distribution of women and men by main age groups, economic
regions and administrative territorial units of the Republic of
Azerbaijan, as of 1 January 2025
1.9. Sex distribution of population aged 14-29 years old by economic
regions and administrative territorial units of the Republic of
Azerbaijan, as of 1 January 2025
1.10. Life expectancy at birth in urban and rural areas
1.11. Healthy life expectancy
1.12. Life expectancy of population at age 60 in urban and rural
areas
1.13. Life expectancy at birth by economic regions and administrative
territorial units
of the Republic of Azerbaijan, 2024
1.14. Total fertility rate in urban and rural areas
1.15. Reproduction rates
1.16. Birth rate of women aged 15-19 in urban and rural areas
1.17. Number and percent of live births by age of mother
1.18. Age-specific birth rates
1.19. Average age of mother at childbirth
1.20. Sex ratio at birth in urban and rural areas
1.21. Sex ratio at birth by economic regions and administrative
territorial units of the Republic of Azerbaijan, 2024
1.22. Live births by births order and sex
1.23. Sex ratio at birth by births order
1.24. Number of live births by officially married mothers, birth
order and sex
1.25. Number of live births by officially unregistered married
mothers, birth order and sex
1.26. Number of live births by birth order and age of officially
married mothers in 2024
1.27. Live births by marital status of mother
1.28. Number of birth by women being at officially unregistered
marriage, economic regions and administrative territorial units
of the Republic of Azerbaijan, 2024
1.29. Distribution of women by marital status and number of births
1.30. Number of twin, triplet and quadruplet births by sex
1.31. Death rate by sex and age groups, 2024
1.32. Main causes of deaths among population, 2024
1.33. Main causes of deaths of population by age groups, 2024
1.34. Number of deaths at working age
1.35. Maternal mortality in urban and rural areas
1.36. Infant mortality in urban and rural areas
1.37 Child mortality under 5 years in urban and rural areas
1.38 Main causes of infant mortality in 2024
1.39 Main causes of child mortality under 5 years in 2024
1.40. Perinatal, neonatal and post-neonatal mortality rate
1.41. Death rate due to road traffic injuries
1.42. Number of births and deaths by economic regions and administrative
territorial units of the Republic of Azerbaijan, 2024
1.43. Officially registered marriages and divorces
1.44. Number and total rate of marriages and divorces by economic
regions and administrative territorial units of the Republic of
Azerbaijan in 2024
1.45. Average age at officially registered marriage
1.46. Number of officially married brides and grooms under 18
years old
1.47. Marriages by age groups of groom and bride in 2024
1.48. Marital status by age groups of groom and bride in 2024
1.49. Divorces by duration of marriage and by age groups of spouses
in 2024
1.50. Marital status of population by age groups
1.51. Distribution of households by number of children under 18
years old
1.52. Households consist of single parent and children
1.53. Migrants by sex and age groups in 2024
1.54 Sex distribution of citizens of Azerbaijan travelled to foreign
countries and foreigners and stateless persons travelled to Azerbaijan
in 2024
2. Health
Methodological explanations
2.1. Distribution of smokers by age groups
2.2. Morbidity of population with malignant neoplasm by age groups
and sex, 2024
2.3. Morbidity of population with malignant neoplasm by different
localizations, 2024
2.4. Morbidity of population with active tuberculosis by age groups
and sex, 2024
2.5. Sex distribution of HIV infected population aged of 15-49
years old
2.6 Hepatitis В incidence by sex
2.7. Morbidity cases with narcological and mental disorders, 2024
2.8. Morbidity among pregnant women
2.9. Number of antenatal clinics and antenatal clinics attached
to enterprices
2.10. Proportion of births attended by skilled health personnel
2.11. Abortions by age groups, 2024
2.12. Use of contraception among married women based on the data
of the "Demographic and Health Survey in Azerbaijan - 2011"
2.13. Number of physicians
2.14. Distribution of persons under 18 years old newly recognized
as disabled, by age groups and sex, 2024
2.15. Distribution of persons newly recognized as disabled at
age 18 years old and over by age groups and sex, 2024
2.16. Distribution of children with obesity by age groups and
sex, 2024
2.17. Sex distribution of persons going to physical culture and
sport
3. Education and scientific personnel
Methodological explanations
3.1. Educational attainment of population aged 15 and over
3.2. Number of children under 3 years of age covered by preschool
education
3.3. Number of children 3 and over years old of age covered by
preschool education at the beginning of the year 2025
3.4. Gender equality index in education
3.5. Number of students by types of educational institutions at
the beginning of 2024/2025 academic year
3.6. Distribution of students by age and sex in vocational educational
institutions at the beginning of 2025
3.7. Distribution of students of state and non-state specialized
secondary institutions by groups of study at the beginning of2024/2025
academic year
3.8. Distribution of students of state specialized secondary institutions
by groups of study at the beginning of2024/2025 academic year
3.9. Distribution of students of non-state specialized secondary
institutions by groups of study at the beginning of2024/2025 academic
year
3.10. Distribution of students of state and non-state higher educational
institutions by groups of study at the beginning of2024/2025 academic
year
3.11. Distribution of students of state higher educational institutions
by groups of study at the beginning of2024/2025 academic year
3.12. Distribution of students of non-state higher educational
institutions by groups of study at the beginning of2024/2025 academic
year
3.13. Distribution of students of the Republic of Azerbaijan graduated
general educational schools and received school-leaving certificate
and admitted to higher educational institutions in 2024 by sex
3.14. Directors and deputies of general educational institutions
at the beginning of 2024/2025 academic year
3.15. Teacher staff of state and non-state higher educational
institutions at the beginning of2024/2025 academic year
3.16. Teacher staff of state higher educational institutions at
the beginning of 2024/2025 academic year
3.17. Teacher staff of non-state higher educational institutions
at the beginning of 2024/2025 academic year
3.18. Teachers of state and non-state institutions by types of
school at the beginning of 2024/2025 academic year
3.19. Proportion of teachers in: (a) pre-primary; (b) primary;
(c) lower secondary and upper secondary education by 2024/2025
academic year
3.20. Participation rate in organized learning (one year before
the official primary entry age)
3.21. Special education institutions for children with limited
health
3.22. Special education institutions for children with limited
health by types of diseases
3.23. Students on PhD program by fields of science at the beginning
of 2025
3.24. Distribution of students studying on PhD program by age
groups at the beginning of 2025
3.25. Students studying on DSc program by fields of science at
the beginning of 2025
3.26. Distribution of students studying on DSc program by age
groups at the beginning of 2025
3.27. Distribution of researches by age groups at the beginning
of 2025
3.28. Researchers by fields of science at the beginning of 2025
3.29. Number of academicians and corresponding members at the
beginning of 2025
4. Employment and wages
Methodological explanations
4.1. Distribution of employees by economic activity, as of January
1, 2025
4.2. Average monthly nominal wages and salaries of employees by
types of economic activity and sex in 2024
4.3. Average monthly nominal wages and salaries of women by types
of economic activity in 2024
4.4. Average monthly nominal wages and salaries of men by types
of economic activity in 2024
4.5. Distribution of unemployment persons registered in State
Employment Agency by age groups in 2024
4.6. Distribution of unemployment persons registered in State
Employment Agency by level of education 2024
4.7. Distribution of persons receivied unemployment insurance
benefits by sex
4.8. Number of disabled persons and fatality in accidents in manufactures
by economic activities in 2024
4.9. Number of persons fatally injured at work by economic activites
in 2024
4.10. Distribution of working in harmful labour conditions in
industry by sex in 2024
4.11. Distribution of working in harmful labour conditions in
construction in 2024
4.12. Distribution of employees holding civil service positions
by sex and age groups, as of January 1, 2025
4.13. Number of women holding civil service positions by age groups
as of January 1, 2025
4.14. Number of men holding civil service positions by age groups
as of January 1, 2025
4.15. Distribution of employees holding auxiliary positions in
civil service by sex and age groups, as of January 1, 2025
4.16. Gender distribution of individual entrepreneurs
4.17. Gender distribution of individual entrepreneurs by types
of activity, as of 1 January 2025
4.18. Gender distribution of individual entrepreneurs by economic
regions and administrative territorial units of the Republic of
Azerbaijan, as of 1 January 2025
4.19. Sex distribution of judges
4.20. Number of women in managerial positions
5. The sample statistical survey on Labour Force
Methodological explanations
5.1. Employment and unemployment in 2024
5.2. Unemployment rate, in per cent
5.3. Distribution of labour force by residence and sex
5.4. Distribution of labour force in working age by residence
and sex
5.5. Distribution of labour force by sex and age groups
5.6. Distribution of employed population by sex and age groups
5.7. Distribution of employed population by sex and economic activity
5.8. Distribution of employed population by sex and educational
level
5.9. Distribution of unemployment rate by residence and age groups
5.10. Distribution of unemployed population by sex and age groups
5.11. Distribution of unemployed population by sex and educational
level
5.12. Distribution of persons outside the labour force by categories
and sex
5.13. Proportion of employed working part-time by sex and age
groups
6. Agriculture, forestry and fishing
Methodological explanations
6.1. Employees working in agricultural works on private owners
and family-peasant farms and households by sex
6.2. Persons participated in wood products purchase by sex
6.3. Persons engaged in fishery in 2024 by sex
7. Welfare and social security
Methodological explanations
7.1. Income structure by sex head of household
7.2. Structure of consumption expenditures by sex of the head
of household
7.3. Consumption of food products by sex of the head of household
7.4. Average weight and height of the population by gender and
age group in 2024
7.5. Average coefficients of body weight of the population by
gender and age groups in 2024
7.6. The level of participation in physical education or any type
of sport by gender and age group of the population, in 2024
7.7. The intensity of engaging in physical education or any type
ofsport by gender and age group of the population, in 2024
7.8. Gender Development Index (GDI)
7.9. Gender Empowerment Measure (GEM)
7.10. Gender Inequality Index (GII)
7.11. Number of persons received pension for the first time
7.12. Number of pensioners
7.13. Gender distribution of persons received driving license
7.14. Gender distribution of internet users
7.15. Gender distribution of persons who have mobile phones
7.16. Sex and age distribution of computer users, 2024
8. Parliament
8.1. Sex distribution of parliamentary elections
8.2. Age and sex distribution of seats in parliamentary, January
1, 2025
8.3. Sex distribution of chairs of committees and commissions
in the Parliament, January 1, 2025
9. Offences
Methodological explanations
9.1. Sex distribution of persons committed crimes in 2024
9.2. Sex distribution of persons committed crimes by types of
crime in 2024
9.3. Sex distribution of persons convicted of crimes in 2024
9.4. Children aged 14-17 convicted by types of crime in 2024
9.5. Sex distribution in domestic violence victims in 2024
9.6. Victims in the result of registered crimes in 2024
9.7. Distribution of women committed crime by types of crime
9.8. Sex distribution of children aged 14-17 committed the crime
9.8. Sex distribution of children aged 14-17 committed the crime
10. International comparisons
Methodological explanations
10.1. Population by sex
10.2. Life expectancy at birth
10.3. Maternal mortality
10.4. Infant mortality rate
10.5. Deaths by causes among women and men
10.6. Distribution of different educational levels of students
and pupils by sex
10.7. Illiteracy rate
10.8. Distribution of labour force by sex
10.9. Labour force participation rate by sex
10.10. Unemployment rate by sex
|