|
|
|
|
THE DEMOGRAPHIC HANDBOOK
OF ARMENIA, 2023
Yerevan, Statistical Committee Of The Republic Of Armenia,
2023, 176 pages
|
https://www.armstat.am/ru/?nid=82&id=2624
|
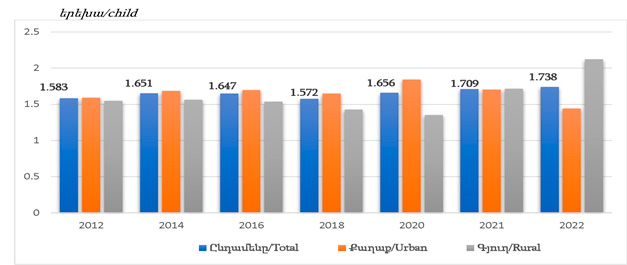
Суммарный коэффициент рождаемости (стр.
60)
Коэффициенты мертворождаемости, неонатальной,
перинатальной и младенческой смертности,
2012-2022 гг. (стр. 78)
|
Год
|
Коэффициенты на 1000 рождений (живорождений
и мертворождений)
|
Коэффициенты на 1000 живорождений
|
|
Мертворо-ждения
|
Неона-тальная
|
Перина-тальная
|
Неонатальная смертность
|
Постнеонатальная смертность
|
Младенческая смертность
|
|
Всего
|
|
2012
|
18,7
|
7,8
|
24,1
|
7,9
|
2,9
|
10,8
|
|
2013
|
16,7
|
7,1
|
21,9
|
7,2
|
2,5
|
9,7
|
|
2014
|
17,0
|
6,6
|
21,8
|
6,7
|
2,1
|
8,8
|
|
2015
|
18,7
|
6,2
|
23,3
|
6,3
|
2,5
|
8,8
|
|
2016
|
16,9
|
6,0
|
21,0
|
6,1
|
2,5
|
8,6
|
|
2017
|
16,5
|
6,1
|
20,6
|
6,2
|
2,0
|
8,2
|
|
2018
|
16,7
|
4,9
|
20,1
|
5,0
|
2,1
|
7,1
|
|
2019
|
16,5
|
4,6
|
19,3
|
4,7
|
1,4
|
6,1
|
|
2020
|
12,3
|
5,5
|
16,0
|
5,6
|
1,8
|
7,4
|
|
2021
|
13,5
|
4,8
|
16,4
|
4,9
|
2,0
|
6,9
|
|
2022
|
11,6
|
5,0
|
14,5
|
5,0
|
1,7
|
6,7
|
|
Город
|
|
2012
|
18,5
|
8,0
|
24,2
|
8,2
|
2,4
|
10,6
|
|
2013
|
16,1
|
7,3
|
21,4
|
7,4
|
2,1
|
9,5
|
|
2014
|
16,7
|
6,4
|
21,4
|
6,5
|
2,1
|
8,6
|
|
2015
|
18,4
|
5,9
|
22,8
|
6,0
|
2,6
|
8,6
|
|
2016
|
16,0
|
5,3
|
19,8
|
5,4
|
2,2
|
7,6
|
|
2017
|
16,3
|
5,5
|
20,2
|
5,6
|
1,6
|
7,2
|
|
2018
|
16,6
|
4,7
|
20,1
|
4,8
|
1,9
|
6,7
|
|
2019
|
15,9
|
4,0
|
18,5
|
4,0
|
1,2
|
5,2
|
|
2020
|
12,5
|
4,6
|
16,1
|
4,7
|
1,4
|
6,1
|
|
2021
|
13,5
|
4,5
|
16,4
|
4,5
|
2,1
|
6,6
|
|
2022
|
14,0
|
6,1
|
17,6
|
6,2
|
1,5
|
7,7
|
|
Село
|
|
2012
|
19,0
|
7,3
|
23,9
|
7,5
|
3,5
|
11,0
|
|
2013
|
17,8
|
6,8
|
22,7
|
6,9
|
3,2
|
10,1
|
|
2014
|
17,6
|
6,8
|
22,4
|
6,9
|
2,2
|
9,1
|
|
2015
|
19,2
|
6,6
|
24,2
|
6,7
|
2,6
|
9,3
|
|
2016
|
18,6
|
7,4
|
23,3
|
7,5
|
3,1
|
10,6
|
|
2017
|
17,0
|
7,4
|
21,4
|
7,5
|
2,6
|
10,1
|
|
2018
|
17,0
|
5,2
|
20,0
|
5,3
|
2,6
|
7,9
|
|
2019
|
17,7
|
5,8
|
20,9
|
5,9
|
1,9
|
7,8
|
|
2020
|
11,7
|
7,6
|
15,8
|
7,7
|
2,5
|
10,1
|
|
2021
|
13,4
|
5,4
|
16,3
|
5,4
|
1,9
|
7,6
|
|
2022
|
8,8
|
3,7
|
10,8
|
3,7
|
1,9
|
5,6
|
Административный учет межгосударственных
передвижений населения по странам, 2020-2022 гг. (стр. 141)
|
Страна прибытия/выбытия
|
Зарегистрировано
|
Снято с регистрации
|
Разность
|
|
2020
|
2021
|
2022
|
2020
|
2021
|
2022
|
2020
|
2021
|
2022
|
|
Всего
|
5961
|
8173
|
12089
|
2587
|
4111
|
5063
|
3374
|
4062
|
7026
|
|
Россия
|
873
|
1055
|
5697
|
860
|
1490
|
1870
|
13
|
-435
|
3827
|
|
Исламская Республика Иран
|
409
|
645
|
573
|
9
|
16
|
16
|
400
|
629
|
557
|
|
Ливан
|
454
|
570
|
486
|
8
|
3
|
19
|
446
|
567
|
467
|
|
Грузия
|
319
|
479
|
1017
|
135
|
429
|
535
|
184
|
50
|
482
|
|
Сирийская Арабская Республика
|
422
|
429
|
563
|
3
|
20
|
20
|
419
|
409
|
543
|
|
Нагорный Карабах
|
474
|
320
|
363
|
347
|
504
|
1144
|
127
|
-184
|
-781
|
|
США
|
111
|
242
|
311
|
156
|
303
|
234
|
-45
|
-61
|
77
|
|
Украина
|
99
|
121
|
317
|
73
|
125
|
115
|
26
|
-4
|
202
|
|
Франция
|
87
|
89
|
559
|
260
|
312
|
368
|
-173
|
-223
|
191
|
|
Казахстан
|
35
|
50
|
80
|
87
|
170
|
60
|
-52
|
-120
|
20
|
|
Германия
|
89
|
42
|
381
|
191
|
248
|
251
|
-102
|
-206
|
130
|
|
Бельгия
|
20
|
26
|
86
|
53
|
39
|
40
|
-33
|
-13
|
46
|
|
Канада
|
10
|
25
|
45
|
10
|
27
|
22
|
-
|
-2
|
23
|
|
Греция
|
20
|
23
|
42
|
56
|
78
|
45
|
-36
|
-55
|
-3
|
|
Иордания
|
11
|
21
|
24
|
-
|
1
|
-
|
11
|
20
|
24
|
|
Испания
|
40
|
20
|
156
|
80
|
108
|
93
|
-40
|
-88
|
63
|
|
Беларусь
|
17
|
19
|
53
|
21
|
31
|
7
|
-4
|
-12
|
46
|
|
Швеция
|
20
|
18
|
36
|
11
|
14
|
21
|
9
|
4
|
15
|
|
Турция
|
12
|
17
|
25
|
1
|
-
|
-
|
11
|
17
|
25
|
|
Нидерланды
|
6
|
12
|
28
|
14
|
21
|
14
|
-8
|
-9
|
14
|
|
Объединенные Арабские Эмираты
|
9
|
11
|
38
|
6
|
7
|
5
|
3
|
4
|
33
|
|
Польша
|
7
|
11
|
54
|
21
|
15
|
30
|
-14
|
-4
|
24
|
|
Туркменистан
|
29
|
10
|
31
|
-
|
-
|
1
|
29
|
10
|
30
|
|
Ирак
|
7
|
10
|
39
|
4
|
2
|
1
|
3
|
8
|
38
|
|
Израиль
|
7
|
10
|
18
|
14
|
13
|
6
|
-7
|
-3
|
12
|
|
Австрия:
|
11
|
9
|
45
|
23
|
26
|
36
|
-12
|
-17
|
9
|
|
Чешский
|
8
|
8
|
21
|
7
|
14
|
21
|
1
|
-6
|
-
|
|
Узбекистан
|
15
|
5
|
31
|
9
|
7
|
2
|
6
|
-2
|
29
|
|
Швейцария
|
1
|
5
|
17
|
2
|
10
|
16
|
-1
|
-5
|
1
|
|
Болгария
|
6
|
4
|
16
|
27
|
16
|
17
|
-21
|
-12
|
-1
|
|
Молдова
|
4
|
3
|
11
|
4
|
3
|
3
|
-
|
-
|
8
|
|
Кувейт
|
-
|
19
|
45
|
-
|
1
|
3
|
-
|
18
|
42
|
|
Другая
|
61
|
47
|
138
|
95
|
58
|
48
|
-34
|
-11
|
90
|
|
Неизвестно
|
2268
|
3798
|
743
|
-
|
-
|
-
|
2268
|
3798
|
743
|
|
В очередном выпуске ежегодника публикуются основные
демографические показатели по Армении за 2022 г. Также, ежегодник
включает разделы, включающие детальную информацию о численности
и составе населения, показателях рождаемости, смертности, мертворождаемости
и младенческой смертности, миграции, а также раздел "интересная
статистика", включающий информацию, не вошедшую в другие разделы.
CONTENTS
Part 1. SUMMARY
Demographic Situation in the Republic of Armenia
1.1. The Administrative-territorial Division
1.2. Main Demographic Indicators for, 2022
1.3. The Figures of De jure Population Number
1.4. The Main Indicators of Natural Movement of Population
1.5. The Main Indicators of Natural Movement of Population by
RA Marzes and c.Yerevan
1.6. Educational Attainment of Mothers to Live births, Deceased
persons, Married and Divorced, 2022
1.7. Results of Civil Status Acts Registracions by Months, 2022
Part 2. POPULATION
2.1. The Age Pyramid of Population, 2012 and 2022, end of the
year
2.2. The Urban/rural Distribution of Population by Main Age Groups,
2012, 2022, end of the year
2.3. Distribution of De jure Population by Sex
2.4. The Components of Change in the Population Numbers for 1990-2022
2.5. The Urban/rural Distribution of De jure Population by RA
Marzes and city Yerevan
2.6. The Urban/ rural Distribution of Midyear De jure Population
by c.Yerevan and RA Marzes, 2012-2022
2.7. Distribution of De jure Population of city Yerevan by Administrative
Districts, begining of the year
2.8. De jure Population of Cities/towns of the Republic of Armenia,
as of the begining of the year
2.9. Distribution of De jure Population of RA by Sex and Age Groups,
begining of year
2.10. Midyear De jure Population of RA by sex and age in 2020-2022
2.11. Population ageing indicators for 2012-2022
2.12. Age Distribution of de jure Population of RA Marzes/city
Yerevan by Urban/rural Areas and sex
2.13. Age Distribution of de jure Population of RA Marzes/city
Yerevan by Urban/rural Areas and sex 01.01.2022
Part 3. BIRTHS
3.1. Total Fertility Rate
3.2. Mean age of mother at childs birth 2012-2022
3.3. Live births by sex and birth order, 2002- 2022
3.4. Age-specific fertility rates, 2002, 2012, 2022??, ‰
3.5. Crude Birth Rates by Urban and Rural Population, 1952-2022
3.6. Live births by Sex and Birth Order, 2012-2022
3.7. Live Births by the Age of Mother, 2012-2022
3.8. Live births by Age of Mothers, RA Marzes and city Yerevan
3.9. Total Fertility and Age-specific Fertility Rates, 2012-2022
3.10. Total Fertility and Age-specific Fertility Rates of RA Marzes
and city Yerevan, 2012-2022
3.11. Total fertility rate, Gross and Net reproductive rates
3.12. Live births outside marriage by age of mother
3.13. Number of Live births by Type of Registration, 2011-2021
3.14. Mean age of Women at Childbirth, 2012-2022
3.15. Mean age of Women at Childbirth by urban/rural distribution,
2012-2022
3.16. Sex Ratio at Birth, of city Yerevan and RA Marz, 2019-2021
3.17. Sex Ratio at Birth by parity, 2011-2021
Part 4. STILLBIRTHS AND INFANT MORTALITY
4.1. Infant Mortality Rate for City Yerevan and RA Marzes for
2012-2022
4.2. Stillbirth and Perinatal Mortality Rates for 2012-2022
4.3. Live births, Stillbirths, Neonatal, Post Neonatal and Infant
Mortality for 2012-2022
4.4. Stillbirths, Neonatal, Perinatal and Infant Mortality Rates
for 2012-2022
4.5. Infant Mortality Rate for 1952-2022
4.5.1. Infant Mortality Rate for 1952-2022 (graph)
4.6. Infant Mortality by Sex for 2012-2022
4.7. Child Mortality by Sex for 2012-2022
4.8. Distribution of Infant deaths and Stillbirths by Sex, RA
Marzes and city Yerevan, 2012-2022
4.9. Infant Mortality by main causes of death, 2012-2022
4.10. Child Mortality in RA Marzes and city Yerevan for 2012-2022
4.11. Child Mortality at the Age 0-4 by Main Causes of Death,
2012-2022
Part 5. MORTALITY
5.1. Life expectancy at birth, 2012-2022
5.2. Mortality by main causes of death for 2002, 2012, 2022
5.3. Death Cases by Sex and Age Groups for 2012-2022
5.4. Crude Death Rate for 1952-2022
5.5. Maternal Mortality Rate for 2012-2022
5.6. Maternal Mortality Rate by RA Marzes and city Yerevan for
2014-2022
5.7. Mortality by Sex and Main Causes of Death for 2019-2022
5.8. Distribution of mortality from novel coronavirus disease
(COVID-19) by RA marzes and city Yerevan
5.9. Mortality from novel coronavirus disease (COVID-19) bay months
of registration, 2020-2022
5.10. Mortality by Main Causes of Death by Marzes and city Yerevan
for 2018-2022
5.11. Age-specific death rates by urban and rural population for
2012-2022
5.12. Distribution of Death Cases Recorded Based on Medical Certificates
and Autopsy by RA Marzes and Districts,2022
5.13. Life Expectancy at Birth for 2012-2022
5.14. Life Expectancy at specified ages, for 2022
5.15. Life Expectancy at Birth for Marzes and city Yerevan, 2020-2022
Part 6. MARRIAGES AND DIVORCES
6.1. Registration of Civil acts on Marriages and Divorces by
Months, 2020-2022
6.2. Mean Age at First Marriage, 2012-2022
6.3. Registered Marriages and Divorces by RA Marzes and city Yerevan
for 2012-2022
6.4. Mean Age at Marriage for 2012-2022
6.5. Mean Age at First Marriage for 2012-2022
6.6. Total Married by Sex and Age for 2012-2022
6.7. First Marriage by Sex and Age for, 2012-2022
6.8. Registered Marriages by Age of Bride and Groom, 2022
6.9. Distribution of Registered Divorces by duration of marriage
for, 2012-2022
6.10. Divorces by the number of common children, 2022
Part 7. MIGRATION
MIGRATION PROCESES IN 2020-2022
7.1. Migration Involvement of Household Members , 2022
7.2. 2020-2022Migration Involvement of Household Members, by Gender
and Urban/Rural Population
7.3. Household Members Absent as of 2022, by Duration of Absence
and by Point of Destination
7.4. Household Members Involved in Migration processes in 2020-2022
according to migration directions, Yerevan and Regions (as of
2022)
7.5. Household Members Involved in Migration over 2020-2022, by
Reasons for Migrating/Returning, as of 2022
7.6. 2020-2022 Migration Involvement of Household Members, by
Age Group (as of 2022)
7.7. 2020-2022 Migration Involvement of Household Members Having
Returned as of 2022, by Point of Return
7.8. Household Members Newly Arrived at Given Community as of
2022, by Point of Arrival
7.9. RA arrivals and departures in 2012-2022
Definition of country of usual residence, of long-term international
migrant and of short-term international migrant
Administrative records of population movements
7.10. Administrative Registrations of population Movements By
Urban/Rural Distribution, 2020-2022
7.11. Distribution of interstate movements registered in the administrative
records, by countries, 2020-2022
7.12. Administrative records of RA population movements by urban/rural
distribution, 2020-2022
7.13. Administrative records of Population movements by marzes
& c.Yerevan, 2020-2022
7.14. Administrative records of Population Interstate movements
by countries, 2020-2022
7.15. General characteristics of administrative records of population
movements by urban/rural distribution, 2019-2021
7.16. Characteristics of interstate movements of administrative
registrations by age groups, 2020-2022
7.17. Administrative registrations of population movements by
age and sex, 2020-2025
7.18. Administrative records of population interstate movements
by age & sex, 2020-2022
7.19. Administrative records of Registered and deregistered population
by sex and age groups, 2020-2022
7.20. Interstate movements
7.21. Distribution of Persons registred/deregistred in the state
population register by country of citizenship and Age groups,
2020-2022
7.22. Distribution of Foreigners Gained RA Residency Status by
Country of Citizenship and Type of Residency, 2022
7.23. Foreigners Gained RA Residency Status by type of Residency
and age groups, 2022
7.24. Foreigners' by type residence status, 2022
7.25. Distribution of Foreigners Gained RA Residency Status by
Country of Citizenship, 2022 (%)
7.26. Asylum Seekers Disagregated by Sex, Age group And Country
of Citizenship
7.27. Distribution of Persons Recognized As Refugee Or No Longer
Recognized As Refugee By Sex, Age Group And Country of Citizenship,
2022
7.28. Distribution of RA Boarder Registrations by Countrries of
Submitted Documents By Persons, 2020-2022
7.29. Distribution of RA Border Registrations by Age Groups, 2020-2022
7.30. Distribution of RA Boarder Registrations by in/out, 1992-2022
7.31. Distribution of Persons Who Received RA Citizenship by Gender,
Main Age Groups and Citizenship 2022
7.32. Distribution of Persons Who Have Received RA Citizenship
And Registered In The Atate Population registerWith Addresses
of RA Settlements By gender, Main Age Groups And Citizenship,
2022
7.33. Distribution of Persons Who Have Received RA Citizenship
And Registered In The Atate Population register With Addresses
In Yerevan, By Gender, Main Age Groups And Citizenship, 2022
7.34. Distribution of Persons Who Have Received RA Citizenship
And Registered In The State Population register With Addresses
of RA Marzes, By gender, Main Age Groups And Citizenship, 2022
7.35. Distribution of Persons Whose RA Citizenship Has Been Terminated
By Gender And Main Age Groups, 2022
Part 8. Interesting statistics
8.1. Grouping of Cities (administrative districts) by the Number
of de Jure Population
8.2. Grouping of Villages by the Number of de Jure Population
8.3. Distribution of Registered Cases of Suicide and Suicide Attempts
in the Republic of Armenia by Sex and Age Groups for 2012-2022
8.4. Live births by mother's ethnicity, 2014-2022
8.5. Deaths by ethnicity, 2014-2022
8.6. Administrative records of registered and de-registered population
according to ethnic composition, 2016-2022
8.7. Marriages by citizenship of bride and groom, 2022
The Most Frequent Names of New-born by Sex, 2022
The Most Frequent Surnames of Newborns, 2022
|