|
|
|
|
THE DEMOGRAPHIC HANDBOOK OF ARMENIA,
2025
Yerevan, Statistical Committee Of The Republic Of Armenia,
2024, 189 pages
|
https://www.armstat.am/en/?nid=82&id=2786
|

Возрастная пирамида населения на начало
2024-2025 года, в процентах от общей численности (стр. 37)
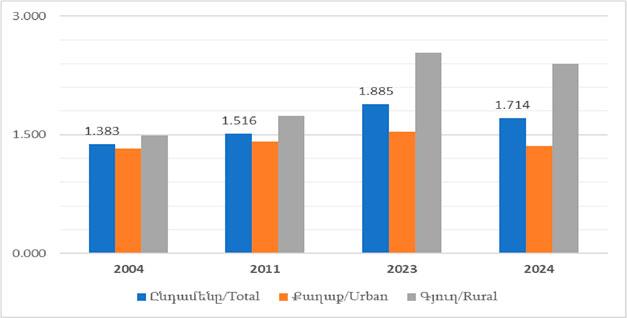
Суммарный коэффициент рождаемости, 2004,
2011, 2023-2024 гг., детей на 1 женщину (стр. 67)
Соотношение полов при рождении по порядку
рождения, 2014-2024 годы (мальчики/девочки) (стр. 79)
| |
Порядок рождения
|
|
первый
|
второй
|
третий
|
четвертый
|
пятый и выше
|
|
2014
|
1,07
|
1,08
|
1,46
|
1,57
|
1,26
|
|
2015
|
1,06
|
1,08
|
1,43
|
1,41
|
1,18
|
|
2016
|
1,09
|
1,07
|
1,31
|
1,36
|
1,19
|
|
2017
|
1,07
|
1,03
|
1,30
|
1,27
|
1,11
|
|
2018
|
1,04
|
1,05
|
1,40
|
1,32
|
1,31
|
|
2019
|
1,04
|
1,07
|
1,27
|
1,26
|
1,14
|
|
2020
|
1,07
|
1,03
|
1,25
|
1,33
|
1,13
|
|
2021
|
1,03
|
1,03
|
1,21
|
1,29
|
1,08
|
|
2022
|
1,06
|
1,08
|
1,23
|
1,27
|
1,08
|
|
2023
|
1,06
|
1,07
|
1,18
|
1,25
|
1,13
|
|
2024
|
1,04
|
1,07
|
1,19
|
1,21
|
1,01
|
Коэффициенты мертворождаемости, неонатальной,
перинатальной и младенческой смертности, 2014-2024 гг. (стр.
84)
| |
Коэффициенты на 1000 рождений (живорождений
и мертворождений)
|
Коэффициенты на 1000 живорождений
|
|
Мертворо-ждения
|
Неоната-льная смертность
|
Перина-тальная смертность
|
Неоната-льная смертность
|
Постеона-тальная смертность
|
Младен-ческая смертность
|
|
Всего
|
|
2014
|
17,0
|
6,6
|
21,8
|
6,7
|
2,1
|
8,8
|
|
2015
|
18,7
|
6,2
|
23,3
|
6,3
|
2,5
|
8,8
|
|
2016
|
16,9
|
6,0
|
21,0
|
6,1
|
2,5
|
8,6
|
|
2017
|
16,5
|
6,1
|
20,6
|
6,2
|
2,0
|
8,2
|
|
2018
|
16,7
|
4,9
|
20,1
|
5,0
|
2,1
|
7,1
|
|
2019
|
16,5
|
4,6
|
19,3
|
4,7
|
1,4
|
6,1
|
|
2020
|
12,3
|
5,5
|
16,0
|
5,6
|
1,8
|
7,4
|
|
2021
|
13,5
|
4,8
|
16,4
|
4,9
|
2,0
|
6,9
|
|
2022
|
11,6
|
5,0
|
14,5
|
5,0
|
1,7
|
6,7
|
|
2023
|
11,4
|
5,0
|
14,6
|
5,0
|
1,6
|
6,6
|
|
2024
|
13,1
|
4,2
|
15,7
|
4,3
|
1,9
|
6,2
|
|
Городская местность
|
|
2014
|
16,7
|
6,4
|
21,4
|
6,5
|
2,1
|
8,6
|
|
2015
|
18,4
|
5,9
|
22,8
|
6,0
|
2,6
|
8,6
|
|
2016
|
16,0
|
5,3
|
19,8
|
5,4
|
2,2
|
7,6
|
|
2017
|
16,3
|
5,5
|
20,2
|
5,6
|
1,6
|
7,2
|
|
2018
|
16,6
|
4,7
|
20,1
|
4,8
|
1,9
|
6,7
|
|
2019
|
15,9
|
4,0
|
18,5
|
4,0
|
1,2
|
5,2
|
|
2020
|
12,5
|
4,6
|
16,1
|
4,7
|
1,4
|
6,1
|
|
2021
|
13,5
|
4,5
|
16,4
|
4,5
|
2,1
|
6,6
|
|
2022
|
14,0
|
6,1
|
17,6
|
6,2
|
1,5
|
7,7
|
|
2023
|
11,9
|
4,9
|
15,2
|
5,0
|
1,7
|
6,7
|
|
2024
|
15,2
|
5,9
|
18,9
|
6,0
|
2,1
|
8,1
|
|
Сельская местность
|
|
2014
|
17,6
|
6,8
|
22,4
|
6,9
|
2,2
|
9,1
|
|
2015
|
19,2
|
6,6
|
24,2
|
6,7
|
2,6
|
9,3
|
|
2016
|
18,6
|
7,4
|
23,3
|
7,5
|
3,1
|
10,6
|
|
2017
|
17,0
|
7,4
|
21,4
|
7,5
|
2,6
|
10,1
|
|
2018
|
17,0
|
5,2
|
20,0
|
5,3
|
2,6
|
7,9
|
|
2019
|
17,7
|
5,8
|
20,9
|
5,9
|
1,9
|
7,8
|
|
2020
|
11,7
|
7,6
|
15,8
|
7,7
|
2,5
|
10,1
|
|
2021
|
13,4
|
5,4
|
16,3
|
5,4
|
1,9
|
7,6
|
|
2022
|
8,8
|
3,7
|
10,8
|
3,7
|
1,9
|
5,6
|
|
2023
|
10,8
|
5,0
|
14,0
|
5,1
|
1,4
|
6,5
|
|
2024
|
10,7
|
2,2
|
12,1
|
2,2
|
1,7
|
3,9
|
Административный учет межгосударственных
передвижений населения по странам, 2022-2024 гг. (стр. 146)
|
Страна прибытия/выбытия
|
Зарегистрировано
|
Снято с регистрации
|
Разность
|
|
2022
|
2023
|
2024
|
2022
|
2023
|
2024
|
2022
|
2023
|
2024
|
|
Всего
|
12089
|
44565
|
80996
|
5063
|
3128
|
2527
|
4062
|
41437
|
78469
|
|
Нагорный Карабах
|
363
|
31434
|
68645
|
1144
|
216
|
-
|
-781
|
31218
|
68645
|
|
Россия
|
5697
|
4187
|
4153
|
1870
|
1324
|
1077
|
3827
|
2863
|
3076
|
|
Грузия
|
1017
|
2186
|
2543
|
535
|
246
|
163
|
482
|
1940
|
2380
|
|
Сирийская Арабская Республика
|
563
|
375
|
405
|
20
|
19
|
35
|
543
|
356
|
370
|
|
Исламская Республика Иран
|
573
|
279
|
396
|
16
|
12
|
9
|
557
|
267
|
387
|
|
Ливан
|
486
|
174
|
224
|
19
|
18
|
22
|
467
|
156
|
202
|
|
США
|
311
|
184
|
193
|
234
|
222
|
211
|
77
|
-38
|
-18
|
|
Украина
|
317
|
125
|
144
|
115
|
103
|
75
|
202
|
22
|
69
|
|
Франция
|
559
|
105
|
102
|
368
|
336
|
299
|
191
|
-231
|
-197
|
|
Казахстан
|
80
|
61
|
70
|
60
|
13
|
9
|
20
|
48
|
61
|
|
Германия
|
381
|
60
|
64
|
251
|
204
|
172
|
130
|
-144
|
-108
|
|
Беларусь
|
53
|
37
|
41
|
7
|
24
|
14
|
46
|
13
|
27
|
|
Греция
|
42
|
29
|
34
|
45
|
45
|
63
|
-3
|
-16
|
-29
|
|
Бельгия
|
86
|
27
|
17
|
40
|
53
|
51
|
46
|
-26
|
-34
|
|
Туркменистан
|
31
|
25
|
26
|
1
|
2
|
2
|
30
|
23
|
24
|
|
Испания
|
156
|
21
|
40
|
93
|
79
|
84
|
63
|
-58
|
-44
|
|
Канада
|
45
|
19
|
15
|
22
|
13
|
18
|
23
|
6
|
-3
|
|
Иордания
|
24
|
11
|
8
|
-
|
-
|
3
|
24
|
11
|
5
|
|
Швеция
|
36
|
13
|
14
|
21
|
14
|
11
|
15
|
-1
|
3
|
|
Турция
|
25
|
14
|
6
|
-
|
1
|
2
|
25
|
13
|
4
|
|
Нидерланды
|
28
|
5
|
12
|
14
|
25
|
20
|
14
|
-20
|
-8
|
|
Объединенные Арабские Эмираты
|
38
|
6
|
13
|
5
|
3
|
13
|
33
|
3
|
0
|
|
Польша
|
54
|
12
|
12
|
30
|
33
|
34
|
24
|
-21
|
-22
|
|
Ирак
|
39
|
8
|
6
|
1
|
1
|
0
|
38
|
7
|
6
|
|
Израиль
|
18
|
15
|
15
|
6
|
6
|
9
|
12
|
9
|
6
|
|
Австрия
|
45
|
13
|
7
|
36
|
14
|
24
|
9
|
-1
|
-17
|
|
Чехия
|
21
|
6
|
10
|
21
|
16
|
17
|
-
|
-10
|
-7
|
|
Узбекистан
|
31
|
7
|
14
|
2
|
1
|
0
|
29
|
6
|
14
|
|
Швейцария
|
17
|
4
|
5
|
16
|
9
|
4
|
1
|
-5
|
1
|
|
Болгария
|
16
|
12
|
6
|
17
|
20
|
12
|
-1
|
-8
|
-6
|
|
Молдова
|
11
|
8
|
5
|
3
|
-
|
1
|
8
|
8
|
4
|
|
Кувейт
|
45
|
12
|
16
|
3
|
1
|
-
|
42
|
11
|
16
|
|
Другие
|
138
|
44
|
44
|
48
|
55
|
73
|
90
|
-11
|
-29
|
|
Неизвестно
|
743
|
5047
|
3691
|
-
|
-
|
-
|
743
|
5047
|
3691
|
|
В очередном выпуске ежегодника публикуются основные
демографические показатели по Армении за 2024 г. Кроме того, ежегодник
включает разделы, включающие детальную информацию о численности
и составе населения, показателях рождаемости, смертности, мертворождаемости
и младенческой смертности, миграции, а также раздел "интересная
статистика", включающий информацию, не вошедшую в другие разделы.
Показатели постоянного населения представлены на основе
данных текущей статистики населения, полученных в ходе переписи
населения Республики Армения 2022 года, с учетом естественного прироста
населения и данных о миграции, зарегистрированных в отчетном году.
Численность постоянного населения за межпереписные годы
2012-2022 была пересчитана на основе результатов переписи населения
Республики Армения 2022 года.
CONTENTS
MAPS
Part 1. SUMMARY
Summary of Main Indicators Characterizing RA Demographic Situation
1.1 The Administrative-territorial Division for 2024
1.2 Main Demographic Indicators for, 2024
1.3 Permanent Population Indicators
1.4 The Main Indicators of Vital Events of Population
1.5 The Main Indicators of Natural Movement of Population by RA
Marzes and c.Yerevan, 2012-2024
1.6 Educational attainment of married and divorced, deceased and
mothers given live births, 2024
1.7 Civil Registrations by Months, 2024
Part 2. POPULATION
2.1 The Age Pyramid of Population, as of the beginning of the
year 2024-2025
2.2 Distribution of Urban/rural Population by Main Age Groups,
as of the beginning of the year 2024-2025
2.3 Distribution of Permanent Population by Sex
2.4 Permanent Population number according to Censuses
2.5 The Components of Changes in the Number of Permanent Population
for 2001-2025
2.6 Permanent Population number by city Yerevan and RA Marzes,
urban/rural distribution as of the beginning of the year
2.7 The Urban/ rural Distribution of Average Permanent Population
by c.Yerevan and RA Marzes, 2012-2024
2.8 Distribution of Permanent Population of city Yerevan by Administrative
Districts
2.9 Permanent Population of Cities/towns of the Republic of Armenia
2.10 Distribution of Permanent Population of RA by Sex and Age
Groups
2.11 Annual Average Permanent Population of RA by sex and age
in 2024
2.12 Dipendency ratio Mea Age and Population ageing index 2012-2024
2.13 Age Distribution of Permanent Population of city Yerevan
and RA Marzes by Urban/rural Areas and sex
2.14 Age Distribution of Permanent Population of city Yerevan
and RA Marzes by Urban/rural Areas and sex
2.15 Age Distribution of Permanent Population of city Yerevan
and RA Marzes by Urban/rural Areas and sex
Part 3.BIRTHS
3.1 Total Fertility Rate, 2004, 2011, 2023-2024
3.2 Mean age of mother at childs birth 2014-2024
3.3 Live births by sex and birth order, 2004-2024
3.4 Age-specific fertility rates, 2004, 2024
3.5 Crude Birth Rates by Urban and Rural Population, 2000-2024
3.5.1 Crude Birth Rates, 1994, 2004, 2014, 2024
3.6 Live births by Sex and Birth Order, 2014-2024
3.7Live Births by the Age of Mother, 2014-2024
3.8 Live births by Age of Mothers, RA Marzes and city Yerevan
3.9 Total Fertility and Age-specific Fertility Rates, 2004, 2023-2024
3.10 Total fertility rate, Gross and Net reproductive rates
3.11 Total Fertility and Age-specific Fertility Rates of RA Marzes
and c.Yerevan, 2023-2024
3.12 Live births outside marriage by age of mother
3.13 Number of Live births by Type of Registration, 2014-2024
3.14 Mean age of Women at Childbirth, 2014-2024
3.15 Mean age of Women at Childbirth by urban/rural distribution,
2014-2024
3.16 Sex Ratio at Birth, of city Yerevan and RA Marz, 2021-2023
3.17 Sex Ratio at Birth by parity, 2014-2024
Part 4.STILLBIRTHS AND INFANT MORTALITY
4.1 Infant Mortality Rates for City Yerevan and RA Marzes for
2014-2024
4.2 Stillbirth and Perinatal Mortality Rates for 2014-2024
4.3 Live births, Stillbirths, Perinatal, Neonatal, Post Neonatal
and Infant Mortality for 2014-2024
4.4 Stillbirths, Neonatal, Perinatal and Infant Mortality Rates
for 2014-2024
4.5 Infant Mortality Rate for 1974-2024
4.5.1 Infant Mortality Rates, 2014, 2016, 2018, 2020-2024
4.6 Infant Mortality by Sex for 2014-2024
4.7 Child Mortality by Sex for 2014-2024
4.8 Distribution of Infant deaths and Stillbirths by Sex, RA Marzes
and city Yerevan, 2014, 2020-2024
4.9 Infant Mortality by main causes of death, 2014, 2016, 2020-2024
4.10 Child Mortality in RA Marzes and city Yerevan for 2014-2024
4.11 Child Mortality at the Age 0-4 by Main Causes of Death, 2014-2024
Part 5: MORTALITY
5.1 Life expectancy at birth, 2022-2024
5.2 Mortality by main causes of death 2004, 2014, 2024
5.3 Death Cases by Sex and Age Groups for 2014, 2020-2024
5.4 Crude Death Rate for 2004-2024
5.5 Crude Death Rate for 2004-2024
5.6 Maternal Mortality Rate for , 2014-2024
5.7 Maternal Mortality Rate by RA Marzes and city Yerevan for
2016-2024
5.8 Mortality by Sex and Main Causes of Death for 2021-2024
5.9 Mortality by Main Causes of Death by Marzes and city Yerevan
for 2020-2024
5.10 Age-specific death rates by urban and rural population for
2023-2024
5.11 Distribution of Death Cases Recorded Based on Medical Certificates
and Autopsy by c.Yerevan, ra Marzes and Communities, 2024
5.12 Life Expectancy at Birth for 2022-2024
5.13 Life expectancy by age and urban/rural distribution for 2024
5.14 Life Expectany at Birth for City Yerevan and RA Marzes, 2023-2024
Part 6. MARRIAGES AND DIVORCES
6.1 Registration of Civil acts on Marriages and Divorces by Months,
2022-2024
6.2 Mean Age at First Marriage, 2014, 2016, 2018, 2020-2024
6.3 Registered Marriages and Divorces by RA Marzes and city Yerevan
for 2014-2024
6.4 Mean Age at Marriage for 2014-2024
6.5 Mean Age at First Marriage for 2014-2024
6.6 Distribution of Married persons by Sex and Age for 2014, 2021-2024
6.7 Distribution of First Time Married persons by Sex and Age
for, 2014, 2021-2024
6.8 Registered Marriages by Age of Bride and Groom, 2024
6.9 Distribution of Registered Divorces by duration of marriage
for, 2014-2024
6.10 Divorces by the Number of Common Children, 2024
Part 7. MIGRATION /MIGRATION PROCESES IN 2022-2024
7.1. Household Members Involved in Migration Processes in 2022-2024
according to Migration Directions, 2024
7.2. Household Members Involved in Migration processes in 2022-2024
according to migration directions, Yerevan and Regions, 2024
7.3 Household Members involved in migration processes within 2022-2024
and not returned in 2024, by the duration of absence and by the
place of their destination
7.4. Household Members Involved in Migration processes in 2022-2024
according to migration directions, Yerevan and Regions, 2024
7.5. Distribution of h/h members involved in migration processes
in 2022-2024 according to the reason for departure/return, 2024
7.6 Age composition of household members involved in the migration
processes within 2022-2024, according to migration directions,
2024
7.7.1 Household Members involved in migration processes within
2022-2024 and not returned in 2024, by the place of their destination
7.7.2 Household Members involved in migration processes within
2022-2024 and returned in 2024, by the place of their destination
7.8 Distribution of newly arrived household members in a given
settlement by place of arrival, as of 2024
7.9 RA arrivals aned departures in 2014-2024
Administrative records of population movements
7.10 Administrative Registrations of population Movements By
Urban/Rural Distribution, 2022-2024
7.11 Distribution of Interstate Movements Registered in the Administrative
Records, by Countries, 2022-2024
7.12 Administrative Records of RA Population Movements by urban/rural
Distribution, 2022-2024
7.13 Administrative Records of Population Movements by marzes
& c.Yerevan, 2022-2024
7.14 Administrative records of Population Interstate Movements
by Countries, 2022-2024
7.15 Administrative Records of Population Movements by Countries
& urban/rural Distribution, 2022-2024
7.16 Administrativ Registrarions of Population Movements by Age
and Sex, 2022-2024
7.17 Administrative Registrations of Population Movements by Age
and Sex, 2022-2024
7.18 Administrative Records of Population Interstate Movements
by age & sex, 2022-2024
7.19 Administrative records of Registered and Deregistered Population
by sex and age groups 2022-2024
Total Movements
7.20 Administrative Records of Registered and Deregistered Population
by sex and age groups 2022-2024
Interstate Movements
7.21 Distribution of Persons Registred/Deregistred in the State
Population Register by Country of Citizenship & Age groups,
2022-2024
7.22 Distribution of Foreigners Gained RA Residency Status by
Country of Citizenship and Type of Residency, 2024
7.23 Distribution of Foreigners Gained RA Residency Status by
Country of Citizenship, 2024
7.24 Distribution of Foreigners Gained RA Residency Status by
Country of Citizenship, 2024
7.25 Asylum Seekers Disagregated by Sex, Age group And Country
of Citizenship 2024
7.26. Asylum Seekers Disagregated by Sex, Age group 2024
7.27. Distribution of Persons Recognized As Refugee By Sex, Age
Group And Country of Citizenship, 2024
7.28. Border Registrations of Entry and exit Performed at RA State
Border Crossing Points according to the Countries Issuing the
Documents Submitted by the Persons, 2022-2024
7.29 Distribution of RA Border Registrations by Age Groups, 2022-2024
7.30 Distribution of RA Boarder Registrations by in/out, 2004-2024
7.31 Distribution of Persons Who Received RA Citizenship by Gender,
Main Age Groups 2022-2024
7.32 Distribution of persons Granted Citizenship of Republic of
Armenia by Country of Previous/Second Citizenship, Sex & Age
Groups, 2024
7.33 Distribution of Persons Whose RA Citizenship Has Been Terminated
By Gender, 2022-2024
7.34 Administrative Records of Population Movements by Marzes
and c. Yerevan, Place of Arrival, by Sex and Main age Groups,
2024
7.35 Distribution of Persons from the Administrative de-registrations
by Marzes and c. Yerevan, by Sex and Main age Groups, 2024
PART 8. INTERESTING STATISTICS
8.1 Grouping of Cities (c.Yerevan Administrative Districts) by
the Number of de Jure Population
8.2 Grouping of Villages by the Number of de Jure Population
8.3 Distribution of Registered Cases of Suicide and Suicide Attempts
in the Republic of Armenia by Sex and Age Groups for 2014, 2020-2024
8.4 Live births by mother's ethnicity, 2016-2024
8.5 Deaths by ethnicity, 2016-2024
8.6 Administrative records of registered and de-registered population
according to ethnic composition, 2018-2024
8.7 Marriages by citizenship of bride and groom, 2024
8.8 Stillbirths by Birth Weight, 2021-2024
8.9 The Most Frequent Names of New-born by Sex, 2024
8.10 The Most Fr Surnames of Newborns, 2024
|