|
|
BRICS
JOINT STATISTICAL PUBLICATION 2025
Brazilian institute of geography and statistics,
2025, 359 pages
|
https://rosstat.gov.ru/storage/mediabank/BRICS_Joint_Statistical_Publication_2025.pdf
|
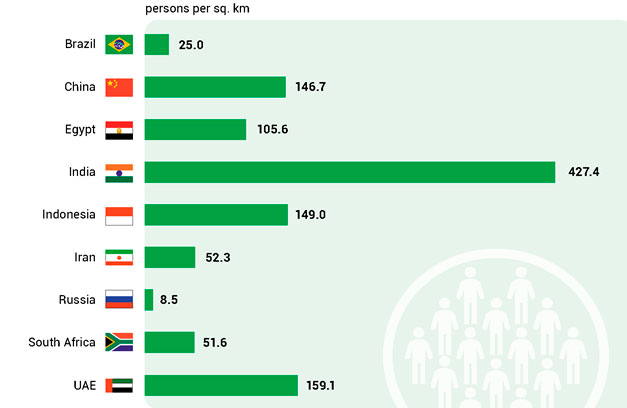
Плотность населения в 2024 г. (стр. 24)

Соотношение полов в 2024 г. (стр. 24)
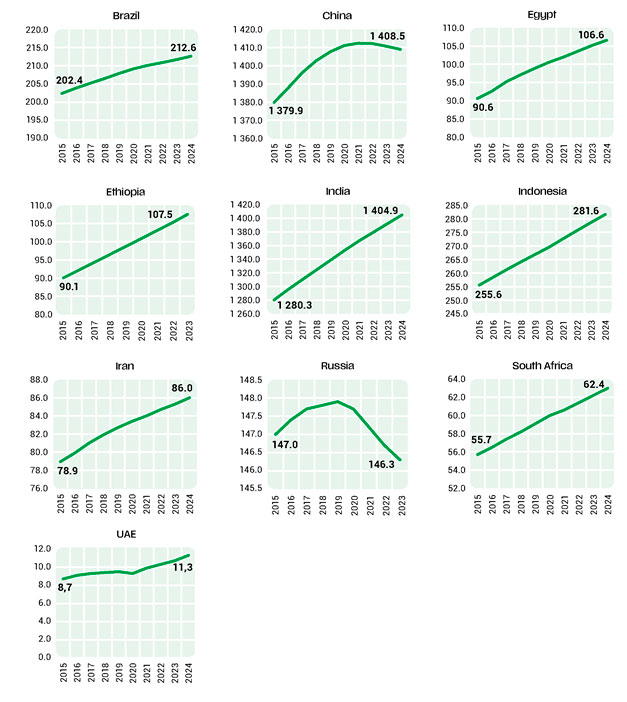
Среднегодовая численность населения (млн. человек),
2015-2024 гг. (стр. 42)
|
BRICS JOINT STATISTICAL PUBLICATION - это документ,
который содержит комплексные статистические данные основных социально-экономических
показателей стран БРИКС как в сравнении, так и в динамике, а также
подробные данные об изменении важнейших макроэкономических и социальных
показателей, таких как показатели экономической активности населения,
динамика и структура ВВП, индексы цен и уровень жизни населения.
Первое совместное статистическое издание БРИКС было
подготовлено в 2010 году. С тех пор регулярно одна из стран БРИКС
выпускает такую публикацию.
Данное издание является пятнадцатым в серии. Оно было
составлено и опубликовано Бразилией, которая временно председательствует
в БРИКС в 2025 году. Совместная статистическая публикация БРИКС
2025 (BRICS JSP 2025), документ, подготовленный странами блока,
призвана предоставить статистические данные по основным социально-экономическим
показателям стран БРИКС, как в сравнительном, так и в динамическом
плане, а также подробные данные об изменениях наиболее важных макроэкономических
и социальных показателей, таких как показатели экономической активности
населения, динамика и структура валового внутреннего продукта (ВВП),
индексы цен и уровень жизни населения.
Публикация состоит из 15 глав и двух приложений. В главе
1 представлена общая информация со сравнительной статистикой для
каждой страны. Главы со 2 по 15 содержат информацию по каждой стране,
охватывающую аспекты прошлого развития и текущую ситуацию. Каждая
глава соответствует определенной теме и состоит из сводной таблицы,
за которой следуют таблицы по странам. Сводные таблицы содержат
максимально сопоставимую информацию по десяти странам и используются
для построения моментального снимка JSP. Таблицы по странам содержат
подробную информацию по каждой стране. Два приложения к данной публикации
представляют собой набор приложений, содержащих обзоры статистических
систем каждой страны, а также информацию о состоянии системы мониторинга
Целей устойчивого развития (ЦУР).
Contents
1 General Information, Economic and Social Indicators
Comparison of BRICS Countries
Table 1.1 General Information on BRICS Countries - 2024
Table 1.2 Economic and Social Indicators Comparison of BRICS Countries
Graph 1.1 Area of territory - 2024
Graph 1.2 Mid-year population - 2024
Graph 1.3 Population density - 2024
Graph 1.4 Gender proportions - 2024
Graph 1.5 Unemployment rate - 2024
Graph 1.6 Consumer Price Index - 2024
2 Population
Table 2.1 Summary of Population on BRICS Countries
Table 2.2.1 Selected Data on Population - Brazil
Table 2.2.2 Selected Data on Population - China
Table 2.2.3 Selected Data on Population - Egypt
Table 2.2.4 Selected Data on Population - Ethiopia
Table 2.2.5 Selected Data on Population - India
Table 2.2.6 Selected Data on Population - Indonesia 7
Table 2.2.7 Selected Data on Population - Iran
Table 2.2.8 Selected Data on Population - Russia
Table 2.2.9 Selected Data on Population - South Africa
Table 2.2.10 Selected Data on Population - United Arab Emirates
Graph 2.1 Mid-year population - 2015-2024
Explanatory Notes
3 Labour Force
Table 3.1 Summary of Labour Force on BRICS Countries
Table 3.2.1 Selected Data on Labour Force - Brazil
Table 3.2.2 Selected Data on Labour Force - China
Table 3.2.3 Selected Data on Labour Force - Egypt
Table 3.2.4 Selected Data on Labour Force - Ethiopia
Table 3.2.5 Selected Data on Labour Force - India
Table 3.2.6 Selected Data on Labour Force - Indonesia
Table 3.2.7 Selected Data on Labour Force - Iran
Table 3.2.8 Selected Data on Labour Force - Russia
Table 3.2.9 Selected Data on Labour Force - South Africa
Table 3.2.10 Selected Data on Labour Force - United Arab Emirates
Explanatory Notes
4 National Accounts
Table 4.1 Summary of National Accounts on BRICS Countries
Table 4.2.1 Selected Data on National Accounts - Brazil
Table 4.2.2 Selected Data on National Accounts - China
Table 4.2.3 Selected Data on National Accounts - Egypt
Table 4.2.4 Selected Data on National Accounts - Ethiopia
Table 4.2.5 Selected Data on National Accounts - India
Table 4.2.6 Selected Data on National Accounts - Indonesia
Table 4.2.7 Selected Data on National Accounts - Iran
Table 4.2.8 Selected Data on National Accounts - Russia
Table 4.2.9 Selected Data on National Accounts - South Africa
Table 4.2.10 Selected Data on National Accounts - United Arab
Emirates
Explanatory Notes
5 Price Indices
Table 5.1 Summary of Consumer Price Index from the Previous Year
on BRICS Countries
Table 5.2.1 Selected Data on Price Indices - Brazil
Table 5.2.2 Selected Data on Price Indices - China
Table 5.2.3 Selected Data on Price Indices - Egypt
Table 5.2.4 Selected Data on Price Indices - Ethiopia
Table 5.2.5 Selected Data on Price Indices - India
Table 5.2.6 Selected Data on Price Indices - Indonesia
Table 5.2.7 Selected Data on Price Indices - Iran
Table 5.2.8 Selected Data on Price Indices - Russia
Table 5.2.9 Selected Data on Price Indices - South Africa
Table 5.2.10 Selected Data on Price Indices - United Arab Emirates
Explanatory Notes
6 People's Living Standard
Table 6.1 Summary of People's Living Standard on BRICS Countries
Table 6.2.1 Selected Data on People's Living Standard - Brazil
Table 6.2.2 Selected Data on People's Living Standard - China
Table 6.2.3 Selected Data on People's Living Standard - Egypt
Table 6.2.5 Selected Data on People's Living Standard - India
Table 6.2.6 Selected Data on People's Living Standard - Indonesia
Table 6.2.7 Selected Data on People's Living Standard - Iran
Table 6.2.8 Selected Data on People's Living Standard - Russia
Table 6.2.9 Selected Data on People's Living Standard - South
Africa
Table 6.2.10 Selected Data on People's Living Standard - United
Arab Emirates
Explanatory Notes
7 Resources and Environment
Table 7.1 Summary of Resources and Environment on BRICS Countries
Table 7.2.1 Selected Data on Resources and Environment - Brazil
Table 7.2.2 Selected Data on Resources and Environment - China
Table 7.2.3 Selected Data on Resources and Environment - Egypt
Table 7.2.4 Selected Data on Resources and Environment - Ethiopia
Table 7.2.5 Selected Data on Resources and Environment - India
Table 7.2.6 Selected Data on Resources and Environment - Indonesia
Table 7.2.8 Selected Data on Resources and Environment - Russia
Table 7.2.9 Selected Data on Resources and Environment - South
Africa
Table 7.2.10 Selected Data on Resources and Environment - United
Arab Emirates
Explanatory Notes
8 Industry
Table 8.1 Summary of Industry on BRICS Countries
Table 8.2.1 Selected Data on Output of Main Industrial Products
- Brazil
Table 8.2.2 Selected Data on Output of Main Industrial Products
- China
Table 8.2.4 Selected Data on Output of Main Industrial Products
- Ethiopia
Table 8.2.5 Selected Data on Output of Main Industrial Products
- India
Table 8.2.6 Selected Data on Output of Main Industrial Products
- Indonesia
Table 8.2.7 Selected Data on Output of Main Industrial Products
- Iran
Table 8.2.8 Selected Data on Output of Main Industrial Products
- Russia
Table 8.2.9 Selected Data on Output of Main Industrial Products
- South Africa
Table 8.2.10 Selected Data on
Explanatory Notes
9 Energy
Table 9.1 Summary of Energy on BRICS Countries
Table 9.2.1 Summary of Energy - Brazil
Table 9.2.2 Summary of Energy - China
Table 9.2.3 Summary of Energy - Egypt
Table 9.2.5 Summary of Energy - India
Table 9.2.6 Summary of Energy - Indonesia
Table 9.2.7 Summary of Energy - Iran
Table 9.2.8 Summary of Energy - Russia
Table 9.2.9 Summary of Energy - South Africa
Table 9.2.10 Summary of Energy - United Arab Emirates
Explanatory Notes
10 Agriculture, Forestry, Animal Husbandry and Fishery
Table 10.1 Summary of Agriculture, Forestry, Animal Husbandry
and Fishery on BRICS Countries
Table 10.2.1 Selected Data on Agriculture, Forestry, Animal Husbandry
and Fishery - Brazil
Table 10.2.2 Selected Data on Agriculture, Forestry, Animal Husbandry
and Fishery - China
Table 10.2.3 Selected Data on Agriculture, Forestry, Animal Husbandry
and Fishery - Egypt
Table 10.2.4 Selected Data on Agriculture, Forestry, Animal Husbandry
and Fishery - Ethiopia
Table 10.2.5 Selected Data on Agriculture, Forestry, Animal Husbandry
and Fishery - India
Table 10.2.6 Selected Data on Agriculture, Forestry, Animal Husbandry
and Fishery - Indonesia
Table 10.2.7 Selected Data on Agriculture, Forestry, Animal Husbandry
and Fishery - Iran
Table 10.2.8 Selected Data on Agriculture, Forestry, Animal Husbandry
and Fishery - Russia
Table 10.2.9 Selected Data on Agriculture, Forestry, Animal Husbandry
and Fishery - South Africa
Table 10.2.10 Selected Data on Agriculture, Forestry, Animal Husbandry
and Fishery - United Arab Emirates
Explanatory Notes
11 Transport
Table 11.1 Summary of Transport on BRICS Countries
Table 11.2.1 Selected Data on Transport - Brazil
Table 11.2.2 Selected Data on Transport - China
Table 11.2.5 Selected Data on Transport - India
Table 11.2.6 Selected Data on Transport - Indonesia
Table 11.2.7 Selected Data on Transport - Iran
Table 11.2.8 Selected Data on Transport - Russia
Table 11.2.9 Selected Data on Transport - South Africa
Table 11.2.10 Selected Data on Transport - United Arab Emirates
Explanatory Notes
12 Information and Communication Technology
Table 12.1 Summary of Information and Communication Technology
on BRICS Countries
Table 12.2.1 Selected Data on Information and Communication Technology
(ICT) - Brazil
Table 12.2.2 Selected Data on Information and Communication Technology
(ICT) - China
Table 12.2.3 Selected Data on Information and Communication Technology
(ICT) - Egypt
Table 12.2.4 Selected Data on Information and Communication Technology
(ICT) - Ethiopia
Table 12.2.5 Selected Data on Information and Communication Technology
(ICT) - India
Table 12.2.6 Selected Data on Information and Communication Technology
(ICT) - Indonesia
Table 12.2.7 Selected Data on Information and Communication Technology
(ICT) - Iran
Table 12.2.8 Selected Data on Information and Communication Technology
(ICT) - Russia
Table 12.2.9 Selected Data on Information and Communication Technology
(ICT) - South Africa
Table 12.2.10 Selected Data on Information and Communication Technology
(ICT) - United Arab Emirates
Explanatory Notes
13 Finance
Table 13.1 Summary of Finance on BRICS Countries
Table 13.2.1 Selected Data on Finance - Brazil
Table 13.2.2 Selected Data on Finance - China
Table 13.2.3 Selected Data on Finance - Egypt
Table 13.2.5 Selected Data on Finance - India
Table 13.2.6 Selected Data on Finance - Indonesia
Table 13.2.7 Selected Data on Finance - Iran
Table 13.2.8 Selected Data on Finance - Russia
Table 13.2.9 Selected Data on Finance - South Africa
Table 13.2.10 Selected Data on Finance - United Arab Emirates
Explanatory Notes
14 External Economic Relations
Table 14.1 Summary of External Economic Relations on BRICS Countries
Table 14.2.1 Selected Data on Merchandise Trade - Brazil
Table 14.3.1 Selected Data on Direct Investment (DI) in Net incurrence
of liabilities - Brazil
Table 14.4.1 Balance of Payments (2024) - Brazil
Table 14.2.2 Selected Data on Merchandise Trade - China
Table 14.3.2 Selected Data on Foreign Direct Investment (FDI)
- China
Table 14.4.2 Balance of Payments - China
Table 14.2.3.1 Selected Data on Merchandise Trade: BRICS Countries
- Egypt
Table 14.2.3.2 Selected Data on Merchandise Trade: Principal Commodities
- Egypt
Table 14.2.3.3 Selected Data on Merchandise Trade: Major Trade
Partners - Egypt
Table 14.2.3.4 Selected Data on Merchandise Trade: Principal Group
Commodities - Egypt
Table 14.2.3.5 Selected Data on Merchandise Trade - Egypt
Table 14.3.3 Selected Data on Foreign Direct Investment (FDI)
- Egypt
Table 14.4.3 Balance of Payments - Egypt
Table 14.2.5.1 Selected Data on Merchandise Trade: Major Trade
Partners - India
Table 14.2.5.2 Selected Data on Merchandise Trade: BRICS Countries
- India
Table 14.2.5.3 Selected Data on Merchandise Trade: Principal Commodities
- India
Table 14.4.5 Balance of Payments - India
Table 14.2.6 Selected Data on Merchandise Trade: BRICS Countries
- Indonesia
Table 14.3.6 Selected Data on Foreign Direct Investment (FDI)
- Indonesia
Table 14.4.6 Balance of Payments - Indonesia
Table 14.4.7 Balance of Payments - Iran
Table 14.2.8.1 Selected Data on Merchandise Trade - Russia
Table 14.2.8.2 Selected Data on Merchandise Trade (2021) - Russia
Table 14.3.8 Selected Data on Foreign Direct Investment (FDI)
- Russia
Table 14.4.8 Balance of Payments - Russia
Table 14.2.9.1 Selected Data on Merchandise Trade: BRICS Countries
(2024) - South Africa
Table 14.2.9.2 Selected Data on Merchandise Trade - South Africa
Table 14.4.9 Balance of Payments 2024 - South Africa
Table 14.2.10 Selected Data on Merchandise Trade - United Arab
Emirates
Table 14.3.10 Selected Data on Foreign Direct Investment (FDI)
- United Arab Emirates
Explanatory Notes
15 Tourism
Table 15.1 Number of Foreign Tourists Arrivals in BRICS Countries
from Different Continents
Table 15.2.1 Foreign Tourists Arrivals by Top 15 Countries or
Territories - Brazil
Table 15.3.1 Foreign Tourists Arrivals in the Country from Different
Macrogeographical Regions - Brazil
Table 15.2.2 Foreign Tourists Arrivals by Top 17 Countries or
Territories - China
Table 15.3.2 Foreign Tourists Arrivals in the Country from Different
Continents and Countries - China
Table 15.2.3 Foreign Tourists Arrivals in the Country from Different
Macrogeographical Regions - Egypt
Table 15.2.4 Foreign Tourists Arrivals in the Country from Different
Continents - Ethiopia
Table 15.2.5 Foreign Tourists Arrivals by Top 15 Countries - India
Table 15.3.5 Foreign Tourists Arrivals in the Country from Different
Continents - India
Table 15.2.6 Foreign Tourists Arrivals in the Country from Different
Macrogeographical Regions -Indonesia
Table 15.2.7 Number of Incoming Tourists and Country of Origin
- Iran
Table 15.2.8 Foreign Tourists Arrivals by Top 18 Countries or
Territories - Russia
Table 15.3.8 Foreign Tourists Arrivals in the Country from Different
Macrogeographical Regions - Russia
Table 15.2.9 Foreign Tourists Arrivals by Top 15 Countries or
Territories - South Africa
Table 15.3.9 Foreign Tourists Arrivals in the Country from Different
Macrogeographical Regions - South Africa
Table 15.2.10 Foreign Tourists Arrivals in the Country from Different
Macrogeographical Regions - United Arab Emirates
Explanatory Notes
Annexures
1 A Brief Overview of the Statistical System of Brazil
2 A Brief Overview of the Statistical System of China
3 A Brief Overview of the Statistical System of Egypt
4 A Brief Overview of the Statistical System of Ethiopia
5 A Brief Overview of the Statistical System of India
6 A Brief Overview of the Statistical System of Indonesia
7 A Brief Overview of the Statistical System of Iran
8 A Brief Overview of the Statistical System of Russia
9 A Brief Overview of the Statistical System of South Africa
10 A Brief Overview of the Statistical System of United Arab Emirates
11 Sustainable development goals for BRICS
Brazil
China
Egypt
Ethiopia
India
Indonesia
Russia
South Africa
United Arab Emirates
|