|
|
|
|
DEMOGRAPHIC SITUATION IN GEORGIA
2024
Statistical Publication
Tbilisi, National Statistics Office of Georgia, 2025,
152 pages
|
https://www.geostat.ge/media/74477/%E1%83%93%E1%83%94%E1%83%9B%E1%83%9D%E1%83
%92%E1%83%A0%E1%83%90%E1%83%A4%E1%83%98%E1%83%A3%E1%83%9A%E1%83%98-
%E1%83%95%E1%83%98%E1%83%97%E1%83%90%E1%83%A0%E1%83%94%E1%83%91%E1
%83%90-%E1%83%A1%E1%83%90%E1%83%A5%E1%83%90%E1%83%A0%E1%83%97%E1%83
%95%E1%83%94%E1%83%9A%E1%83%9D%E1%83%A8%E1%83%98-2024-.pdf
|
Возрастные коэффициенты рождаемости, суммарный
коэффициент рождаемости и коэффициенты воспроизводства (стр.
31)
|
Годы
|
Всего
|
Коэффициенты рождаемости в возрасте
|
Суммарный коэффициент рождаемости
|
Коэффициент воспроизводства
|
|
-20
|
20-24
|
25-29
|
30-34
|
35-39
|
40-44
|
45+
|
Брутто
|
Нетто
|
|
2011
|
47,7
|
47,1
|
125,0
|
106,9
|
63,5
|
28,0
|
6,3
|
0,3
|
1,89
|
0,90
|
0,88
|
|
2012
|
47,0
|
43,0
|
120,3
|
105,5
|
65,6
|
28,5
|
6,9
|
0,4
|
1,85
|
0,88
|
0,87
|
|
2013
|
47,4
|
42,2
|
119,1
|
106,2
|
67,3
|
30,5
|
7,2
|
0,4
|
1,86
|
0,90
|
0,88
|
|
2014
|
58,6
|
51,5
|
144,7
|
131,3
|
86,5
|
38,9
|
9,2
|
0,7
|
2,31
|
1,12
|
1,10
|
|
2015
|
58,2
|
48,4
|
144,1
|
128,0
|
87,7
|
41,5
|
10,6
|
0,7
|
2,31
|
1,10
|
1,09
|
|
2016
|
56,5
|
43,4
|
134,9
|
127,5
|
86,4
|
43,7
|
11,2
|
0,8
|
2,24
|
1,10
|
1,08
|
|
2017
|
54,2
|
36,2
|
126,1
|
126,9
|
84,5
|
44,0
|
10,5
|
0,5
|
2,14
|
1,03
|
1,02
|
|
2018
|
53,4
|
32,3
|
121,9
|
127,5
|
85,4
|
44,3
|
11,0
|
0,6
|
2,12
|
1,02
|
1,00
|
|
2019
|
50,8
|
29,4
|
112,1
|
121,3
|
81,2
|
44,6
|
12,4
|
1,5
|
2,01
|
0,97
|
0,96
|
|
2020
|
49,4
|
27,3
|
103,3
|
121,8
|
81,6
|
44,4
|
13,3
|
1,7
|
1,97
|
0,94
|
0,93
|
|
2021
|
49,2
|
24,8
|
100,4
|
126,7
|
86,9
|
44,8
|
12,1
|
0,8
|
1,98
|
0,95
|
0,94
|
|
2022
|
45,2
|
21,9
|
90,2
|
113,7
|
83,1
|
42,9
|
11,6
|
1,1
|
1,82
|
0,88
|
0,87
|
|
2023
|
42,7
|
20,3
|
77,7
|
102,0
|
79,1
|
43,8
|
14,4
|
2,7
|
1,70
|
0,81
|
0,80
|
|
2024
|
42,0
|
17,7
|
72,3
|
97,7
|
81,9
|
44,9
|
15,6
|
3,8
|
1,67
|
2,1
|
0,79
|
Соотношение полов при рождении по порядку
рождения (стр. 33)
|
Год
|
Всего
|
Порядок рождения:
|
|
I
|
II
|
III+
|
|
2011
|
109,4
|
108,5
|
104,9
|
125,3
|
|
2012
|
109,7
|
109,6
|
106,5
|
118,1
|
|
2013
|
107,7
|
105,7
|
104,3
|
121,9
|
|
2014
|
106,9
|
104,7
|
104,9
|
117,2
|
|
2015
|
109,0
|
105,0
|
107,7
|
120,8
|
|
2016
|
104,4
|
101,8
|
102,9
|
112,2
|
|
2017
|
107,9
|
107,1
|
105,1
|
114,4
|
|
2018
|
107,9
|
105,8
|
106,8
|
112,7
|
|
2019
|
107,6
|
106,1
|
105,7
|
113,3
|
|
2020
|
109,3
|
107,3
|
107,5
|
114,3
|
|
2021
|
108,5
|
105,9
|
108,7
|
112,5
|
|
2022
|
107,2
|
104,9
|
107,0
|
110,6
|
|
2023
|
109,4
|
106,5
|
108,2
|
114,4
|
|
2024
|
110,8
|
109,0
|
106,7
|
118,1
|
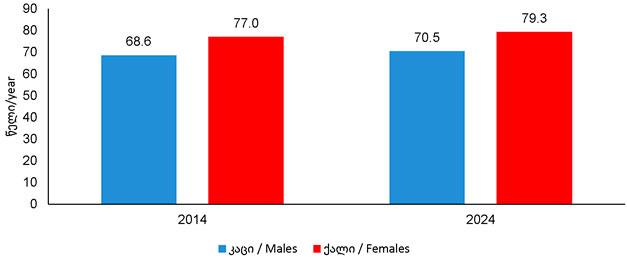
Ожидаемая продолжительность жизни при
рождении, лет (стр. 54)
Иммигранты по гражданству (человек) (стр.
63)
|
Гражданство
|
2015
|
2016
|
2017
|
2018
|
2019
|
2020
|
2021
|
2022
|
2023
|
2024
|
|
Всего
|
92557
|
90228
|
83239
|
88152
|
96864
|
89996
|
74008
|
179778
|
205857
|
135811
|
|
Азербайджан
|
2839
|
3420
|
3501
|
3761
|
3669
|
1951
|
2526
|
2563
|
4301
|
4556
|
|
Соединенные Штаты Америки
|
1081
|
1101
|
1075
|
1159
|
1349
|
1110
|
1352
|
1502
|
2004
|
1635
|
|
Турция
|
5810
|
6294
|
4365
|
3934
|
3419
|
1776
|
2813
|
3946
|
8624
|
5214
|
|
Индия
|
800
|
1435
|
2686
|
3015
|
2846
|
1615
|
1400
|
3948
|
8406
|
4594
|
|
Иран, Исламская Республика
|
1766
|
418
|
1335
|
3798
|
5664
|
397
|
473
|
1177
|
1435
|
839
|
|
Российская Федерация
|
10552
|
11185
|
9723
|
10323
|
11515
|
6546
|
10881
|
62304
|
52627
|
23574
|
|
Греция
|
974
|
627
|
569
|
644
|
543
|
236
|
300
|
594
|
805
|
526
|
|
Грузия
|
50924
|
47086
|
48343
|
47883
|
54478
|
66668
|
39526
|
54405
|
91896
|
65436
|
|
Армения
|
4143
|
6241
|
2042
|
2174
|
2274
|
1770
|
987
|
1528
|
3093
|
1811
|
|
Украина
|
2886
|
2922
|
2275
|
2175
|
2303
|
969
|
2006
|
20716
|
7516
|
6898
|
|
Китай
|
1267
|
873
|
904
|
974
|
944
|
1026
|
2246
|
1095
|
2000
|
1746
|
|
Другое
|
9370
|
8409
|
6340
|
8217
|
7791
|
5901
|
9449
|
25940
|
22991
|
18930
|
|
Лица без гражданства
|
145
|
217
|
81
|
94
|
69
|
31
|
49
|
60
|
157
|
52
|
|
Не указано
|
0
|
0
|
0
|
1
|
0
|
0
|
0
|
0
|
2
|
0
|
Средний возраст супругов (лет) по полу
и очередности брака (стр. 74)
|
Год
|
Всего
|
Первый брак
|
Повторный брак
|
|
Мужчины
|
Женщины
|
Мужчины
|
Женщины
|
Мужчины
|
Женщины
|
|
2011
|
30,2
|
26,5
|
29,4
|
25,9
|
43,0
|
39,0
|
|
2012
|
30,8
|
27,2
|
29,8
|
26,5
|
42,6
|
38,5
|
|
2013
|
30,9
|
27,4
|
30,1
|
26,8
|
40,5
|
37,3
|
|
2014
|
31,3
|
28,1
|
30,0
|
26,6
|
42,1
|
38,7
|
|
2015
|
31,4
|
28,2
|
30,0
|
27,1
|
42,1
|
38,8
|
|
2016
|
31,4
|
28,3
|
30,1
|
27,2
|
41,6
|
38,1
|
|
2017
|
31,6
|
28,6
|
30,2
|
27,4
|
41,1
|
37,8
|
|
2018
|
32,0
|
29,0
|
30,4
|
27,7
|
41,5
|
38,2
|
|
2019
|
32,6
|
29,7
|
30,7
|
28,1
|
41,7
|
38,9
|
|
2020
|
32,4
|
29,6
|
30,7
|
28,1
|
40,7
|
37,9
|
|
2021
|
33,6
|
30,9
|
31,5
|
29,0
|
42,2
|
39,7
|
|
2022
|
33,9
|
31,4
|
31,9
|
29,4
|
42,0
|
39,7
|
|
2023
|
34,4
|
31,9
|
32,1
|
29,7
|
42,7
|
40,5
|
|
2024
|
34,8
|
32,4
|
32,2
|
29,9
|
43,8
|
41,4
|
|
Статистическое издание "Демографическая ситуация
в Грузии 2024 г." является ежегодным сборником, в котором отражены
демографические процессы и их тенденции в Грузии.
Публикация содержит данные временных рядов о населении
и его половозрастной структуре, рождаемости, смертности, браках,
разводах, естественном приросте и международной миграции. Информация
приводится как по стране в целом, так и по ее регионам.
В публикации, начиная с 1994 года, данные не охватывают
оккупированные территории Автономной Республики Абхазия и Схинвальского
района, а начиная с 2009 года - территории Аджарского и Ахалгорского
муниципалитетов.
Contents
Preface
Population censuses in Georgia
Number of population by Type of settlement according to the population
census data
Number of population by sex according to the population census
data
The main demographic indicators
Number of population as of 1 January, the components of population
change and population growth (%)
The main demographic ratios per 1000 population
Population
Population by selected characteristics, as of 1 January
Number of population by sex and age groups, as of 1 January (thousands)
Population distribution by urban-rural settlements and population
density, as of 1 January
Population of capital city and cities of 100000 or more inhabitants,
as of 1 January
Births
Births by selected characteristics
Number of live births and crude birth rate by urban-rural settlements
Number of live births by age of mother and mean age of childbearing
Age-specific fertility rates, total fertility rate and reproduction
rates
Number of live births by birth order (persons)
Sex ratio at birth by birth order
Number of live births by legitimacy status (persons)
Number of live births by month (persons)
Live births by selected medical characteristics (persons)
Number of stillbirths and crude stillbirth rate by urban-rural
settlements
Deaths
Deaths by selected characteristics and life expectancy at birth
Number of deaths and crude death rate by urban-rural settlements
Number of deaths by sex and age groups (persons)
Number of infant deaths and infant mortality rate by sex
Number of infant deaths by age and sex (persons)
Number of under-5 deaths and mortality rate by sex
International Statistical Classification of Diseases and Related
Health Problems 10th Revision - Main Chapters
Deaths by sex and chapters7F of ICD-10 (persons)
Cause-specific death rate by sex (per 100000 population)
Number of deaths by month (persons)
Life expectancy by age and sex (in years)
Natural increase
Natural increase and natural increase rate by urban-rural settlements
Migration
International migration by selected characteristics
Number of immigrants by sex and age groups (persons)
Number of emigrants by sex and age groups (persons)
Immigrants by citizenship and sex (persons)
Emigrants by citizenship and sex (persons)
Marriages
Registered marriages by selected characteristics
Number of registered marriages and crude marriage rate by urban-rural
settlements
Number of married people by sex and age groups - total (units)
Number of married people by sex and age groups - first marriage
(units)
Number of married people by sex and age groups - remarriage (units)
Mean age of spouses (in years) by sex and order of marriages
Number of married people by previous marital status and sex (units)
Number of registered marriages by month (units)
Divorces
Divorces by selected characteristics
Number of registered divorces and crude divorce rate by urban-rural
settlements
Number of divorced people by sex and age groups (units)
Number of registered divorces by duration of marriage
Number of registered divorces by month (units)
Regions and self-governed units
Number of population by regions, self-governed units and urban-rural
settlements, as of 1 January (thousands)
Population growth (%) by regions
Density (number of population per 1 sq.km) by regions and self-governed
units, as of 1 January
Median age (in years) by sex and regions according to the population
census data
Number of live births by regions, self-governed units and urban-rural
settlements (persons)
Number of stillbirths by regions, self-governed units and urban-rural
settlements (persons)
Number of deaths by regions, self-governed units and urban-rural
settlements (persons)
Natural increase by regions, self-governed units and urban-rural
settlements (persons)
Number of registered marriages by regions, self-governed units
and urban-rural settlements (units)
Number of registered divorces by regions, self-governed units
and urban-rural settlements (units)
Definitions
|