|
|
|
|
Olga Penina, France Mesle, Jacques
Vallin
MORTALITY TRENDS BY CAUSES OF DEATH IN THE REPUBLIC
OF MOLDOVA, 1965-2020
Кишинэу,CEP Medicina, 2022, 277 pages
|
|
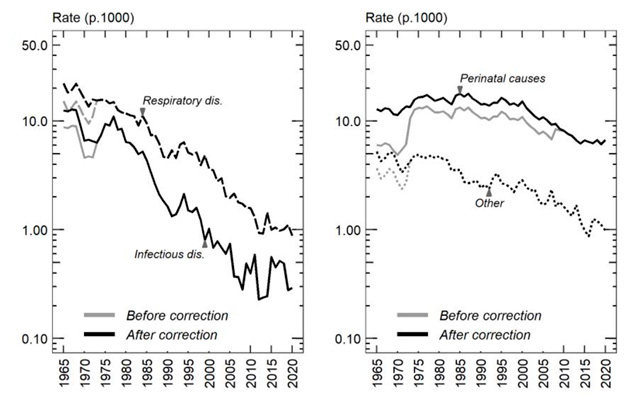
Тенденции в показателях младенческой смертности
за 1965-2020 годы по четырем группам причин смерти до и после
коррекции из-за неполной регистрации (стр. 139)
Ожидаемая продолжительность жизни при
рождении до и после двух поправок на коэффициент младенческой
смертности (m0) и поправку
на смертность в пожилом возрасте, 1959-2020 годы, в разбивке
по полу (стр. 221-223)
|
Год
|
Грубый
|
После 1-й коррекции m0
|
После 2-й коррекции m0
|
После двух коррекций m0
и коррекции смертности в пожилом возрасте
|
|
МУЖЧИНЫ
|
|
1959
|
65,29
|
63,56
|
63,33
|
61,13
|
|
1960
|
67,29
|
65,78
|
65,57
|
62,82
|
|
1961
|
67,66
|
66,32
|
66,12
|
63,74
|
|
1962
|
66,37
|
65,03
|
64,84
|
63,73
|
|
1963
|
67,19
|
65,89
|
65,71
|
64,32
|
|
1964
|
67,88
|
66,55
|
66,35
|
64,54
|
|
1965
|
68,04
|
66,87
|
66,69
|
65,57
|
|
1966
|
67,76
|
66,74
|
66,56
|
65,62
|
|
1967
|
66,73
|
65,64
|
65,45
|
64,93
|
|
1968
|
66,45
|
65,32
|
65,14
|
64,89
|
|
1969
|
65,97
|
65,00
|
64,84
|
|
|
1970
|
66,32
|
65,46
|
65,28
|
|
|
1971
|
66,07
|
65,24
|
65,04
|
|
|
1972
|
66,25
|
65,40
|
65,18
|
|
|
1973
|
64,86
|
|
64,64
|
|
|
1974
|
64,17
|
|
63,94
|
|
|
1975
|
63,04
|
|
62,80
|
|
|
1976
|
63,77
|
|
63,49
|
|
|
1977
|
62,61
|
|
62,31
|
|
|
1978
|
62,86
|
|
62,60
|
|
|
1979
|
62,11
|
|
61,86
|
|
|
1980
|
62,87
|
|
62,57
|
|
|
1981
|
62,62
|
|
62,30
|
|
|
1982
|
62,92
|
|
62,64
|
|
|
1983
|
62,38
|
|
62,10
|
|
|
1984
|
62,18
|
|
61,86
|
|
|
1985
|
62,72
|
|
62,37
|
|
|
1986
|
64,92
|
|
64,57
|
|
|
1987
|
65,56
|
|
65,21
|
|
|
1988
|
65,32
|
|
64,99
|
|
|
1989
|
65,56
|
|
65,26
|
|
|
1990
|
65,08
|
|
64,80
|
|
|
1991
|
64,25
|
|
63,99
|
|
|
1992
|
64,03
|
|
63,73
|
|
|
1993
|
64,22
|
|
63,96
|
|
|
1994
|
62,44
|
|
62,12
|
|
|
1995
|
62,14
|
|
61,75
|
|
|
1996
|
63,11
|
|
62,83
|
|
|
1997
|
63,13
|
|
62,78
|
|
|
1998
|
64,00
|
|
63P,67
|
|
|
1999
|
63,53
|
|
63,28
|
|
|
2000
|
63,68
|
|
63,37
|
|
|
2001
|
64,14
|
|
63,91
|
|
|
2002
|
63,92
|
|
63,68
|
|
|
2003
|
63,82
|
|
63,61
|
|
|
2004
|
63,88
|
|
63,69
|
|
|
2005
|
62,91
|
|
62,70
|
|
|
2006
|
63,41
|
|
63,21
|
|
|
2007
|
63,68
|
|
63,54
|
|
|
2008
|
63,94
|
|
63,89
|
|
|
2009
|
63,66
|
|
63,64
|
|
|
2010
|
62,96
|
|
|
|
|
2011
|
64,85
|
|
|
|
|
2012
|
64,97
|
|
|
|
|
2013
|
65,86
|
|
|
|
|
2014
|
65,21
|
|
|
|
|
2015
|
65,11
|
|
|
|
|
2016
|
65,57
|
|
|
|
|
2017
|
66,65
|
|
|
|
|
2018
|
66,24
|
|
|
|
|
2019
|
66,60
|
|
|
|
|
2020
|
65,85
|
|
|
|
|
ЖЕНЩИНЫ
|
|
1959
|
69,62
|
67,72
|
67,55
|
64,39
|
|
1960
|
72,08
|
70,41
|
70,25
|
66,43
|
|
1961
|
72,00
|
70,50
|
70,36
|
67,31
|
|
1962
|
71,05
|
69,54
|
69,40
|
67,63
|
|
1963
|
71,98
|
70,59
|
70,44
|
68,25
|
|
1964
|
73,38
|
71,99
|
71,85
|
69,26
|
|
1965
|
73,05
|
71,77
|
71,63
|
69,91
|
|
1966
|
73,35
|
72,18
|
72,05
|
70,19
|
|
1967
|
72,56
|
71,39
|
71,25
|
69,90
|
|
1968
|
72,61
|
71,37
|
71,23
|
70,03
|
|
1969
|
71,96
|
70,89
|
70,75
|
70,43
|
|
1970
|
72,32
|
71,42
|
71,28
|
70,92
|
|
1971
|
72,22
|
71,39
|
71,24
|
71,02
|
|
1972
|
72,28
|
71,39
|
71,23
|
70,89
|
|
1973
|
71,04
|
|
70,88
|
70,60
|
|
1974
|
70,64
|
|
70,49
|
70,07
|
|
1975
|
69,52
|
|
69,32
|
69,08
|
|
1976
|
70,20
|
|
70,03
|
69,75
|
|
1977
|
69,53
|
|
69,34
|
69,21
|
|
1978
|
69,51
|
|
69,30
|
|
|
1979
|
68,54
|
|
68,35
|
|
|
1980
|
69,39
|
|
69,21
|
|
|
1981
|
69,59
|
|
69,38
|
|
|
1982
|
69,96
|
|
69,77
|
|
|
1983
|
69,20
|
|
69,00
|
|
|
1984
|
69,06
|
|
68,83
|
|
|
1985
|
69,30
|
|
69,05
|
|
|
1986
|
71,32
|
|
71,10
|
|
|
1987
|
71,49
|
|
71,23
|
|
|
1988
|
71,85
|
|
71,63
|
|
|
1989
|
72,35
|
|
72,12
|
|
|
1990
|
72,10
|
|
71,89
|
|
|
1991
|
71,13
|
|
70,89
|
|
|
1992
|
72,00
|
|
71,81
|
|
|
1993
|
71,25
|
|
71,03
|
|
|
1994
|
69,92
|
|
69,76
|
|
|
1995
|
69,87
|
|
69,72
|
|
|
1996
|
70,57
|
|
70,35
|
|
|
1997
|
70,57
|
|
70,42
|
|
|
1998
|
71,47
|
|
71,26
|
|
|
1999
|
71,22
|
|
70,99
|
|
|
2000
|
71,22
|
|
70,97
|
|
|
2001
|
71,69
|
|
71,45
|
|
|
2002
|
71,45
|
|
71,27
|
|
|
2003
|
71,21
|
|
71,05
|
|
|
2004
|
71,92
|
|
71,76
|
|
|
2005
|
71,07
|
|
70,92
|
|
|
2006
|
71,59
|
|
71,43
|
|
|
2007
|
71,67
|
|
71,47
|
|
|
2008
|
72,16
|
|
72,07
|
|
|
2009
|
72,34
|
|
72,32
|
|
|
2010
|
72,11
|
|
|
|
|
2011
|
73,61
|
|
|
|
|
2012
|
73,38
|
|
|
|
|
2013
|
73,89
|
|
|
|
|
2014
|
73,59
|
|
|
|
|
2015
|
73,61
|
|
|
|
|
2016
|
74,08
|
|
|
|
|
2017
|
74,85
|
|
|
|
|
2018
|
74,93
|
|
|
|
|
2019
|
74,99
|
|
|
|
|
2020
|
73,86
|
|
|
|
Примечание: С 1998 года официальная статистика населения
не включает регион Приднестровье
|
В данной монографии рассматриваются тенденции смертности
от ряда конкретных причин смерти в Молдове за период 1965-2020 гг.
Монография состоит из пяти глав. В первой главе рассматриваются
тенденции смертности по полу и возрасту в Молдове с конца 1950-х
годов. В ней описывается система регистрации смертей как в советский
период, так и после обретения независимости, исследуются данные
о смертности, особенно младенцев и пожилых людей, а также данные
о численности населении и предлагаются методы исправления неполных
данных. Во второй главе представлено краткое описание прошлой и
нынешней системы регистрации причин смерти в Молдове. В третьей
главе представлен метод реконструкции рядов смертности по Молдове
на конкретных примерах. В четвертой главе проанализированы и сопоставлены
с украинскими тенденциями реконструированные тенденции смертности
по полу, возрасту и основным группам причин смерти. В пятой главе
представлено описание тенденций смертности по полу, возрасту и подробным
причинам смерти. Каждая глава завершается кратким изложением основных
выводов. Общие выводы и приложения приведены в конце монографии.
Реконструированные ряды смертности доступны и регулярно
обновляются в базе Human Cause-of-Death Database https://www.causesofdeath.org.
Доступно несколько статистических приложений к монографии, в том
числе в режиме онлайн (https://github.com/PeninaOlga).
TABLE OF CONTENTS
Acknowledgments
Introduction
References
Chapter I. Half-century evolution of sex- and age-specific
mortality
1. The history of the death registration system
A. During the Soviet period
B. After independence
2. Correcting for population estimates
A. During the Soviet period
B. After independence
3. Correcting mortality estimates
A. Infant mortality
B. Old-age mortality
4. Readjustment of life expectancy at birth
5. Age-specific mortality trends
References
Chapter II. Registration, collection and quality of
cause-of-death data
1. The history of cause-of-death classifications
A. During the Soviet period
B. After independence
2. Collected data
3. Data quality
References
Chapter III. Reconstruction of the time series
1. The method of reconstruction: the case of the transition from
1965-SC to 1970-SC
A. Correspondence tables
B. Fundamental associations of items
C. Transition coefficients
2. Other transitions
A. Transition from 1970-SC and 1981-SC
B. Abolishment of work accident definition in 1988-SC
C. Transition from 1988-SC to ICD-9
D. Transition from ICD-9 to ICD-10
3. Additional adjustment of the reconstructed time series
A. A posteriori corrections of some time series
B. The peculiar case of senility
References
Chapter IV. Mortality by age, sex and main groups of
causes of death
1. Decomposition of life expectancy at birth changes into specific
effects of mortality trends by age and main groups of causes
A. Global changes in life expectancy in Moldova and Ukraine since
1965
B. Changes in life expectancy over six periods
2. Trends in standardised mortality rates by main groups of causes
of death
A. Overview of trends in mortality from main groups of causes
of death
B. Comparison with Ukraine
References
Chapter V. Mortality by age, sex and detailed causes
of death
1. Causes of death at under one year old
A. Major causes of death
B. Infectious diseases and diseases of the respiratory system
C. Other diseases
D. Deaths from injury and poisoning
2. Causes of deaths in children aged 1-14
A. Major causes of death
B. Diseases of the respiratory system
C. Deaths from injury and poisoning
D. Neoplasms
E. Other diseases
3. Causes of death in young adults aged 15-39
A. Major causes of death
B. Deaths from injury and poisoning
C. Infectious diseases
D. Other diseases
5. Causes of death in mature adults aged 40-64 years
A. Major causes of death
B. Diseases of the circulatory system
C. Neoplasms
D. Deaths from injury and poisoning
E. Digestive diseases
F. Infectious diseases and diseases of the respiratory system
G. Other diseases
6. Causes of death at older adults aged 65 years and over
A. Major causes of death
B. Diseases of the circulatory system
C. Respiratory and infectious diseases
D. Neoplasms
E. Digestive diseases
F. Deaths from injury and poisoning
G. Other diseases
References
Conclusions
References
Annexe 1. Life expectancy at birth before and after two corrections
of infant mortality rate (m0) and old-age mortality correction,
1959-2020, by sex
Annexe 2. Life expectancy at different ages, 1959-2020, by sex
Annexe 3. List of causes of death used in reconstructed series and
their correspondence with ICD-10 codes
Annexe 4. Standardised mortality rates by sex and cause according
to the list of ICD-10 items, 1965-2020 (per 1 million)
Annexe 5. The impact of mortality trends by age, sex and cause on
the changes in life expectancy at birth since 1965 and over six
different periods
|